Polkadot price analysis shows that the cryptocurrency is going strong with a bullish momentum with a potential of hitting the $5.92 mark in the near future. The support level for DOT/USD is at $5.70, and breaking below this level could increase market volatility. However, the major resistance for this cryptocurrency is at $5.94 and it is likely to be tested in the near future if the bullish momentum continues.
The DOT/USD started today’s trading section in bearish territory, as the price was fluctuating below the $5.70 support level. However, later in the day, there was a strong bullish momentum that pushed the price to highs of $5.92 before it started retracing. There are signs that the bullish momentum could continue, and if this happens, DOT/USD could reach higher levels in the near future.
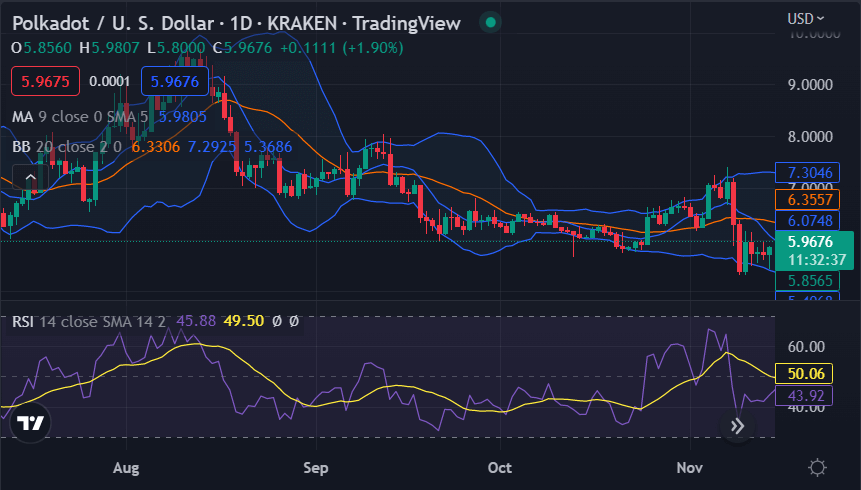
Polkadot price analysis 1-day price chart: DOT/USD has been steadily increasing over time
The daily price chart for Polkadot price analysis shows that the cryptocurrency has been experiencing a steady increase in value over time. The price is currently sitting at $5.70, with an increase of 2.36% from yesterday’s close. The Polkadot price has been trading in a range between $5.52 and $5.70, with strong support at the lower end of the range. The Moving average of the indicator is present at the $5.98 mark above the price level.

The volatility for DOT/USD is currently low, as the price has been moving sideways in a tight trading range. The Bollinger Bands indicator is also showing that the price is likely to stay within the range in the near future, with upper Bollinger Band levels at $5.94 and lower levels at $5.52. The RSI for Polkadot price analysis is currently at 50.06, indicating a neutral market positioning with some bullish momentum.
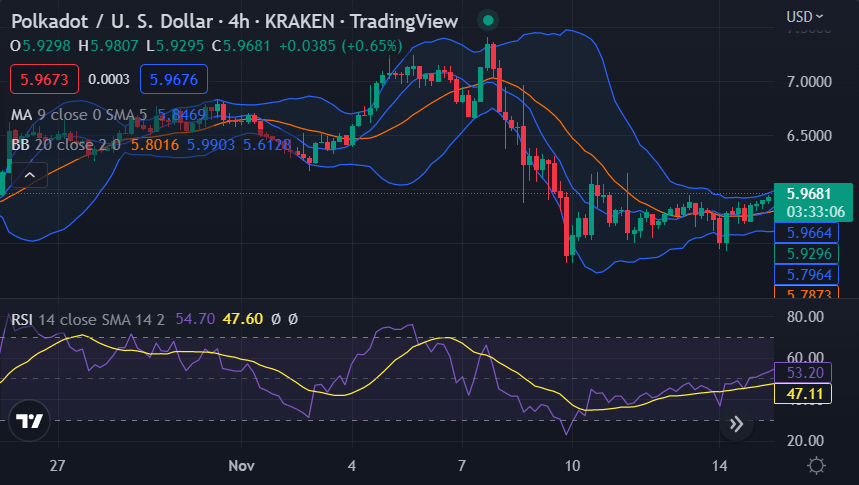
DOT/USD 4-hour chart: Polkadot price is currently above the $5.70 level
Looking at the 4-hour chart for Polkadot price analysis, we can see that the price is currently trading above the $5.70 support level, with some bearish momentum. However, this could change soon as there are bullish signals forming on the chart, indicating a potential increase in value over time. Prices have recently broken out of a symmetrical triangle pattern which is a bullish sign. The market is expected to retrace back to the $5.92 level before resuming its upward move. The bears will be looking to take control of the market if prices break below the $5.72 level.

The RSI on 4-hour is currently at 47.11, which is in the oversold region and indicates that the market might be due for a correction. The 50-Moving average and 200-moving averages are both still rising, which indicates that the long-term trend is still bullish, With MA starting at the $5.84 mark. The Bollinger Bands indicator is also starting to widen, which shows that volatility could start increasing as the price moves up or down.
Polkadot price analysis conclusion
Based on the analysis of Polkadot price analysis, it seems that this cryptocurrency is showing strong bullish momentum at the moment. There are signs that prices could break out of the current trading range and move higher in the near future, although there is also a possibility of a downward correction taking hold if market conditions change.
Disclaimer. The information provided is not trading advice. Cryptopolitan.com holds no liability for any investments made based on the information provided on this page. We strongly recommend independent research and/or consultation with a qualified professional before making any investment decisions.


