Polkadot price analysis shows highly bullish signs on the daily view, as price boosted up by more than 12 percent over the past 24 hours. DOT moved up to $6.38, the highest point in over a month with today’s extension, with price also looking likely to move up to $7.50 over the current trend. In the current bull run, Polkadot price has risen over 40 percent since January 1 when price was at a lowly $4.32. With further upward movement expected, traders will also be vary of potential sell offs coming up in the market as price settles just below $6 mark at the time of writing.
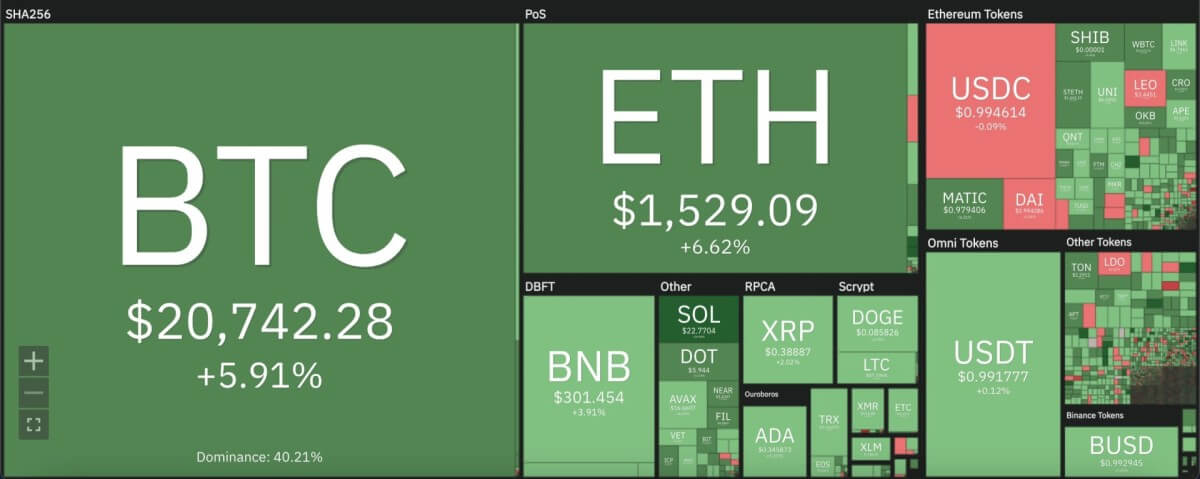
The larger cryptocurrency market showed bullish signs to mimic Polkadot’s movement, as Bitcoin moved back past the psychologically crucial $20,000 mark with a 6 percent rise. Ethereum rose 7 percent to move up to $1,500, while leading Altcoins showed similar upward trends. Ripple moved up to $0.38 with a 2 percent rise, whereas Dogecoin rose up to $0.08 with a 5 percent increment. Cardano also moved up to $0.34, with Solana recording a massive 26 percent rise to boost up to $22.79.

Polkadot price analysis: RSI moves deep into overbought region on daily chart
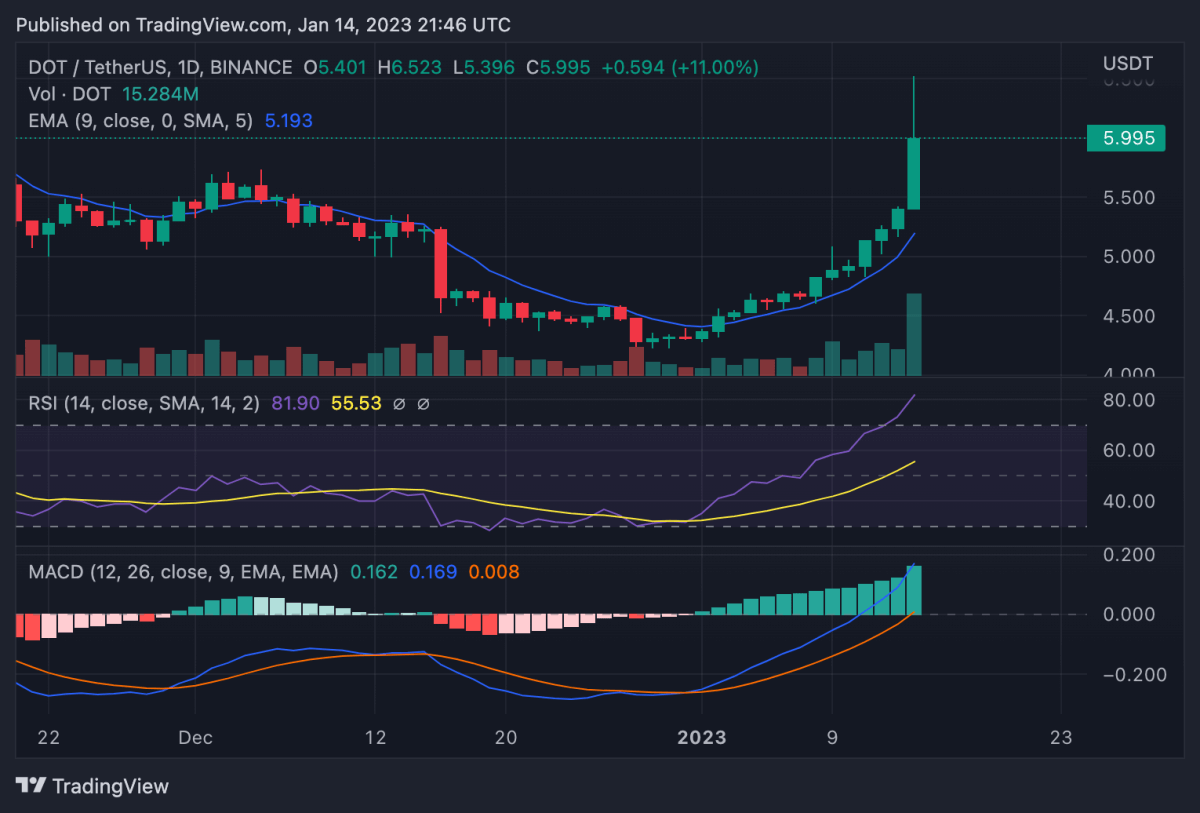
On the 24-hour candlestick chart for Polkadot price analysis, price can be seen extending along an ascending triangle pattern since the start of the new year. With yesterday’s 12 percent increment, price rose clear of the 9 and 21-day moving averages, along with the crucial 50-day exponential moving average (EMA) at $5.2.

The 24-hour relative strength index (RSI) can be seen rising heavily over the recent uptrend. Over the past 24 hours, the RSI has moved from 70.17 up to 81.87, which can be considered as deep overbought zone. The RSI movement could determine the future fate of the cryptocurrency, with the current value indicating a price correction to come. Meanwhile, the moving average convergence divergence (MACD) curve shows a bullish divergence in place, with trading volume over the past 24 hours rising 272 percent.
Disclaimer. The information provided is not trading advice. Cryptopolitan.com holds no liability for any investments made based on the information provided on this page. We strongly recommend independent research and/or consultation with a qualified professional before making any investment decisions.


