Polkadot price analysis confirms a strong bearish trend for the market as the price has fallen to the lowest level at $6.15. This is a critical situation for the buyers as the cryptocurrency faced bearish resistance during the past few days, and the price levels have been decreasing continuously, setting a lower low today. Although the situation favored the buyers in the previous week, the bears managed to escape the bullish wave this week. Currently, the coin value sits at the $6.15 position, and it might drop even further if the selling pressure increases further.
Polkadot price analysis 1-day price chart: Bears take control as DOT/USD breaches key support at $6.10
The daily Polkadot price analysis shows the bears are in the leading position as an intense selling activity has been taking place today. Although the market was under the bearish influence for the last two days, today’s trend proved relatively more overwhelming as the price levels fell tremendously low. The market value of DOT/USD has dropped up to $6.15, losing 1.09 percent more because of the downward trend. The moving average (MA) value is $6.15 as the SMA 20 curve is trading below the SMA 50 curve.

The RSI indicator for DOT/USD is currently at 42.00 and is heading towards oversold levels which could see bulls make a comeback soon. The upper Bollinger Band is currently at $6.53 and the lower Bollinger Band is at $6.13. The DOT/USD price is currently very close to the lower Bollinger Band which could see a rebound in prices soon.
Polkadot price analysis: Recent developments and further technical indications
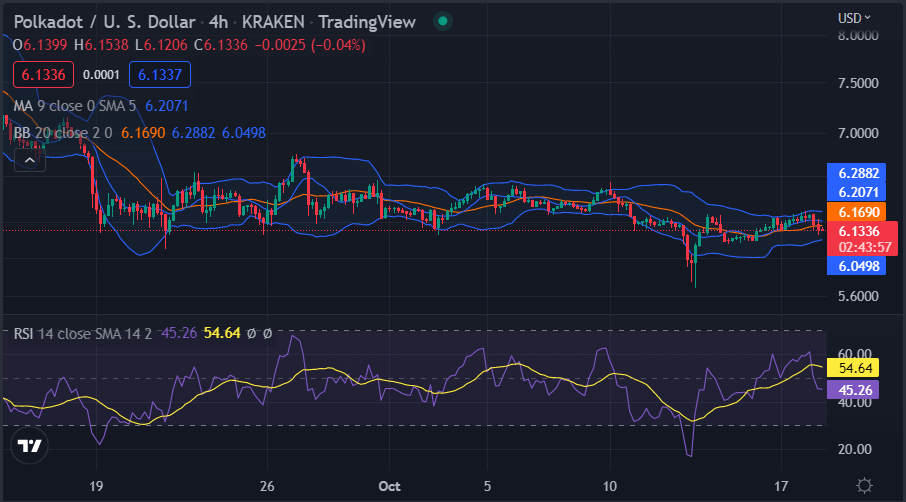
The four-hour Polkadot price analysis further confirms a strong bearish trend as the coin value has dropped exceedingly in the past few hours. The bears have been overruling the bulls for the past few hours by securing consecutive wins. Currently, the selling activity intensifies further as the coin value has been lowered to $6.15 extreme. Chances of further devaluation in cryptocurrency value are also there. Moreover, the moving average value in the hourly price chart is at $6.20 point.

The Relative Strength Index indicator is moving toward oversold levels which could see the market make a move toward $54.64 in the near future. The Bollinger Bands for DOT/USD are currently very close to each other which indicates that the market is in a state of consolidation.
Polkadot price analysis: Conclusion
To conclude, Polkadot price analysis shows a decrease in the price today, as the circumstances have proved unfavorable for cryptocurrency. The bears are struggling to maintain a high momentum and have succeeded in causing a decline in the price to the $6.15 range. Yet, as the bullish momentum in the past week had been seen to be reviving, it can be expected that it might bounce back to take the price above the $6.29 level.


