The Polkadot price analysis shows a bearish trend today, with the coin trading below its psychological mark of $6. The bears have exerted downward pressure, resulting in a drop in the DOT price to $5.79. While the bullish performance was more favorable yesterday, the selling pressure began building earlier, leading to the current market situation. Furthermore, the selling pressure remains high above the $6 range, preventing the bulls from pushing the price above $5.86 yesterday.
DOT/USD 1-day price chart: Bears Maintain Control
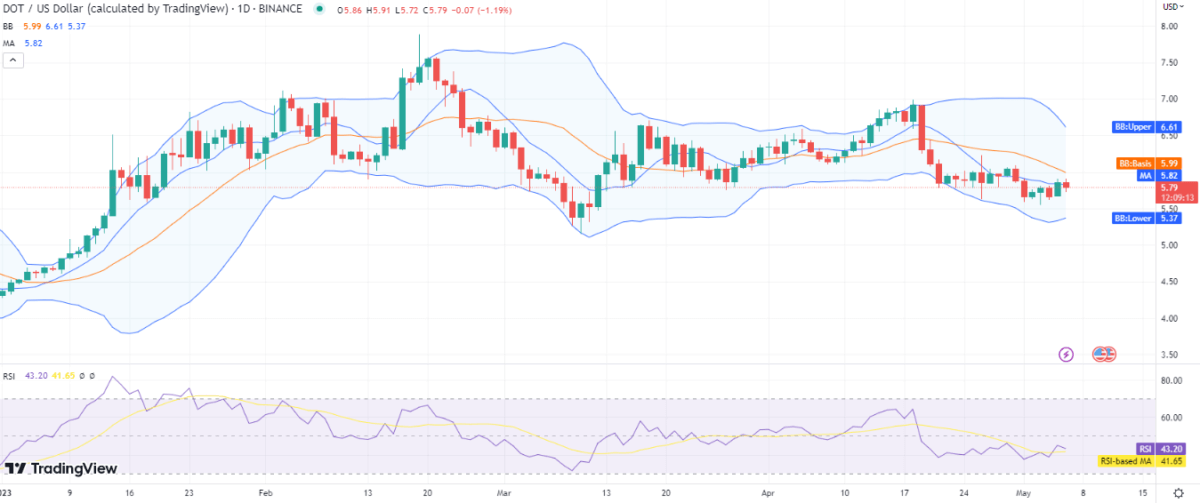
The 1-day analysis of the Polkadot price analysis reveals a continued decline, with the coin trading at $5.79 below its psychological level of $6 at the time of writing. Over the past few days, there has been a power struggle between the bulls and the bears, with the balance shifting in favor of the bears. However, yesterday saw a shift towards the bullish side, which was short-lived as the bears have since regained control. The DOT/USD pair has seen a decline of 3.88 percent over the past week. Despite this decline, the trading volume has increased by 16.56 percent today.

The DOT/USD pair has exhibited a relatively high range of volatility, as indicated by the Bollinger Bands. The upper band at $6.61 represents a resistance level, while the lower band at $5.37 acts as a support zone for the falling pair. The volatility indicator’s average line is forming at $5.99, which is currently above the cryptocurrency’s price level. Convergence of the indicator indicates a decrease in volatility in the future.
The Relative Strength Index (RSI) is currently showing a downward trend, with the score decreasing over time. The RSI is currently trading in the lower half of the neutral region, with a score of 43, indicating a selling activity in the market.
Polkadot price analysis: Recent developments and further technical indications
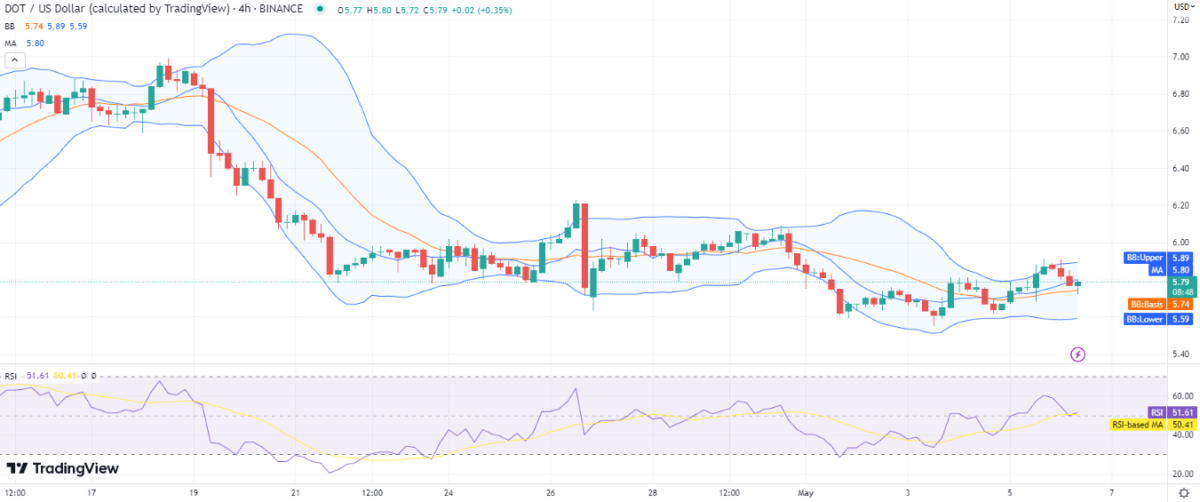
The 4-hour price chart for Polkadot price analysis reveals a decline in price, with bulls attempting to make a comeback but not yet succeeding. Although a small green candlestick is visible on the chart, indicating a possible shift in momentum, breaking out of the current bearish cycle appears challenging as the price oscillations are sluggish. Additionally, the recent buying process may prove to be temporary if the selling pressure persists.

The 4-hour chart analysis shows a low degree of volatility, with the Bollinger Bands indicating resistance at the upper band of $5.89 and support at the lower band of $5.59. The mean average of the indicator is currently at $5.74. Meanwhile, the Relative Strength Index (RSI) is trending upwards with a score of 51, suggesting progress by buyers in the market.
Polkadot price analysis conclusion
The current Polkadot price analysis suggests a bearish market with downward pressure on the coin. While a potential price recovery towards $6 is possible with increased support for bulls, the current situation favors the bears, and the price may close within the mid $5 range today. The likelihood of a bearish scenario is relatively higher due to the current market conditions.


