Polkadot price analysis for today shows that the cryptocurrency has broken below the $7.00 level, indicating a potential downside movement in prices. Currently, support for DOT prices is found at $6.68, with resistance seen at $7.14. However, if the bearish trend continues and breaks below the support level, further support can be found at the $6.40 and $6.00 levels, and a break above resistance could push prices toward the $7.40 and $7.80 levels.
Bulls were in control of the market last week, pushing DOT prices above $7.50 before the bearish pressure took hold. The Polkadot price analysis has decreased by 1.60% in the past 24 hours, with a current trading price of $6.93. In terms of market cap, Polkadot is currently ranked at number 12 with a market cap of $7.53 billion and a 24-hour trading volume of $354 million.
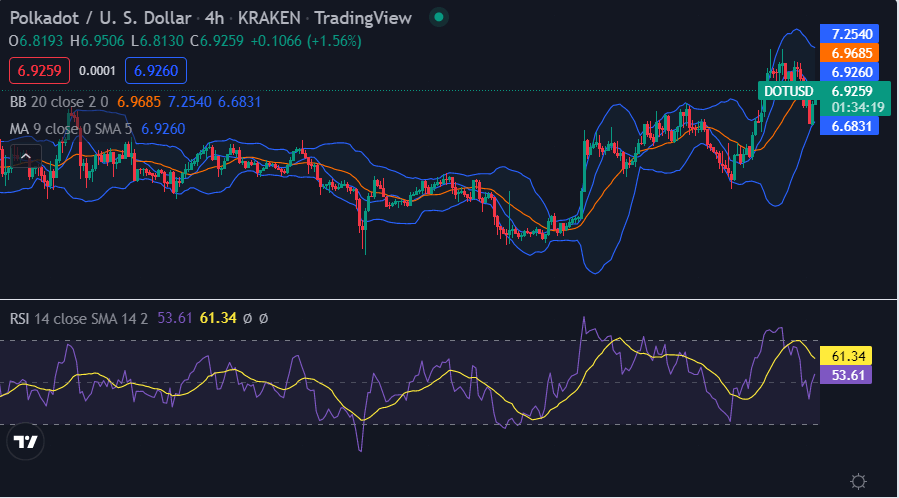
DOT/USD 4-hour chart: Polkadot to see more downside before reversal
The 4-hour chart for Polkadot price analysis shows that the cryptocurrency has broken below a rising trendline, indicating potential downside movements in prices. The market has formed high-wick candles, indicating intense bearish pressure. The bullish might attempt to push the prices back above $7.14, but the bearish pressure may continue to dominate in the short term.

The Relative Strength Index (RSI) is currently below 50, indicating that downside momentum has taken over from bullish momentum. The trendline is currently trading below the 50-period and 200-period moving averages. The Relative Strength Index (RSI) indicator is currently at 61.34, indicating a neutral market sentiment. The Bollinger bands indicator average has decreased to $6.94, whereas the upper Bollinger band is showing a $7.25 reading, and the lower band is showing a $6.68 reading, representing high volatility range for DOT.
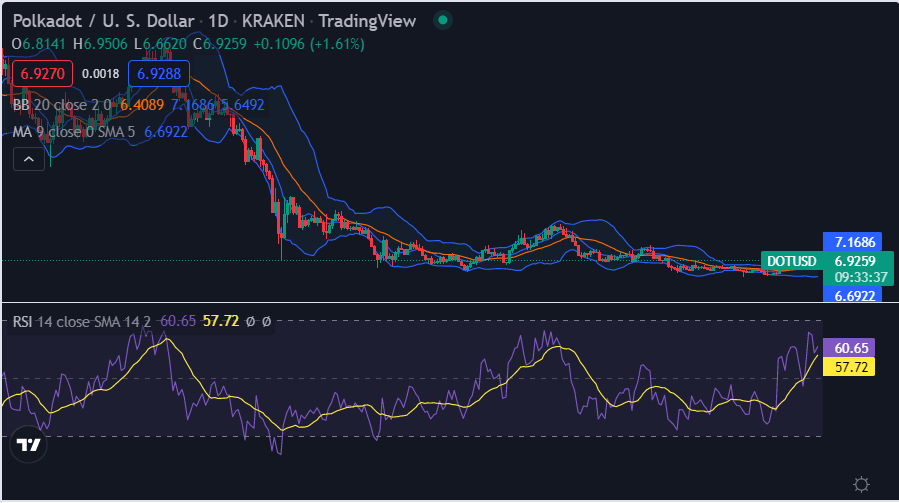
Polkadot price analysis in the last 24 hours: DOT/USD retraces below the $7.00 level
The Daily Polkadot price analysis is showing a bearish trend for today as the price has depreciated today as well. The bearish momentum has been continuing over the last 24 hours as the price has been lowered to the $6.93 level after the latest drop. The moving average indicator (MA) is present at the $6.69 mark above the price level.

The Relative Strength Index (RSI) is present at index 57.72 in the neutral region, indicating unfavorable circumstances for DOT, as the downward curve of the indicator shows the selling activity in the market, which is depreciating its value. The upper Bollinger band value is $7.16, whereas the lower Bollinger band value is $5.64.
Polkadot price analysis conclusion
To conclude our Polkadot price analysis shows a bearish market trend, with the DOT trading at the $6.93 level after breaking below the $7.00 level. The market may see some selling pressure in the near future as the technical indicators are mostly bearish. However, the bulls may try to push prices back above $7.14 in the short term, but bearish pressure is currently dominating the market.
Disclaimer. The information provided is not trading advice. Cryptopolitan.com holds no liability for any investments made based on the information provided on this page. We strongly recommend independent research and/or consultation with a qualified professional before making any investment decisions.


