The Polkadot price analysis shows that the price of DOT/USD has followed a downward trend in the last 24 hours. The price has shifted towards an antagonistic movement, decreasing significantly, dropping from the $5.89 mark, the cost of DOT was down 0.37% in the last 24 hours, with a trading volume of $302,057,460. Ranking #12 in the cryptocurrency ranking with a live market capital of $6,573,364,555.
DOT/USD 4-hour price analysis: Latest developments
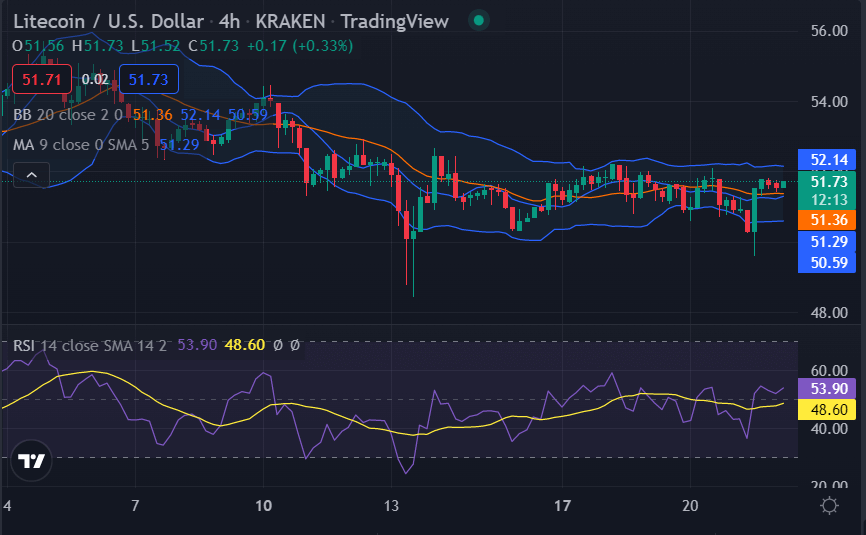
The Polkadot price analysis has revealed market volatility showing dormant dynamics, making market consistency a priority, which means the cryptocurrency’s price will remain constant until the volatility starts to fluctuate on either extreme. The resistance and support bands appear to have closed the gap, resulting in the market entering a squeeze, hence lower volatility.

The upper limit of the Bollinger’s band is present at $5.89, while the lower limit of the Bollinger’s band limit is available at $5.77, The DOT/USD price seems to be crossing under the Moving Average curve, indicating a bearish trend. Furthermore, the price path appears to be following a downward direction toward the support. The Polkadot price analysis reveals that the Relative Strength Index (RSI) is 48.60, representing a stable cryptocurrency; the value is present in the lower neutral region.
Polkadot price analysis for 1 day: Market favors the bears
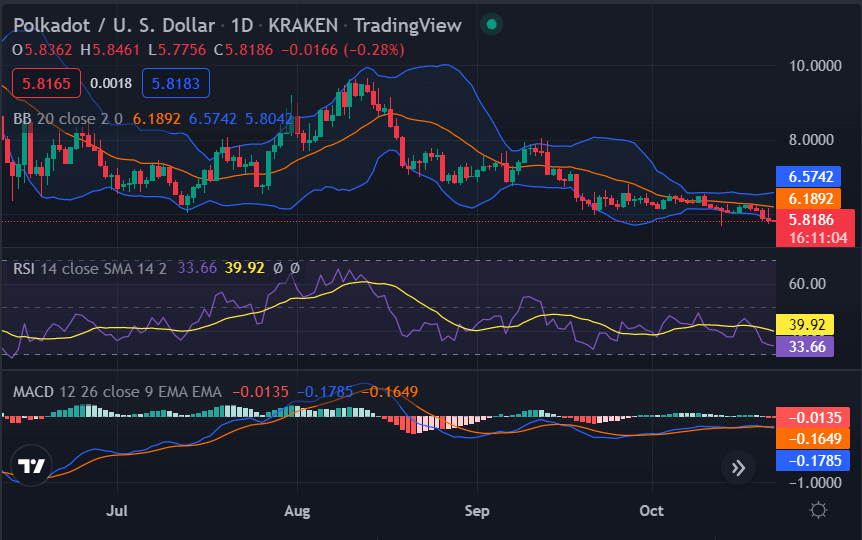
The Daily Polkadot price analysis shows that market volatility follows an increasing direction. This means that DOT/USD prices subject to fluctuations will fluctuate in the same direction as volatility; more volatility means more probability of the price shifting to either extreme. The upper limit of Bollinger’s band exists at $5.89, which acts as the strongest resistance for DOT. On the other hand, the lower limit of Bollinger’s band is available at $5.77, representing the strongest support for DOT.

The DOT/USD price seems to be crossing under the Moving Average curve, indicating a bearish trend. Furthermore, we can observe the price path following a linear movement which may indicate a reversal as the Moving Average seems to move in a negative direction. The Polkadot price analysis reveals that the Relative Strength Index (RSI) is 39.92, which means that the cryptocurrency shows severe signs of being undervalued.
Polkadot price analysis conclusion
To conclude, The Polkadot price analysis concludes that the cryptocurrency shows bearish momentum with slight bullish opportunities. The price has dropped to $5.77 on October 22, 2022, and is currently stuck at the $5.83 mark this seems that the bears have reclaimed control of the market, which may cause a further devaluation of the market.
Disclaimer. The information provided is not trading advice. Cryptopolitan.com holds no liability for any investments made based on the information provided on this page. We strongly recommend independent research and/or consultation with a qualified professional before making any investment decisions.


