Polkadot price analysis indicates a downward trend today as the market slides below $5.68.The current support levels for DOT/USD are $5.62 and the resistance was found at $5.87 after experiencing a 24-hour loss of 3.24%. Bears have been leading the market for the past 24- hours, and the price has been dropping at a consistent rate. This puts its total market cap at $6,447,321,574 and a 24-hour trading volume of $174,728,848.The cryptocurrency pair ranks #11 in the market.
Polkadot price analysis on a 1-day price chart: Bearish pressure increases as prices stabilize at $5.67
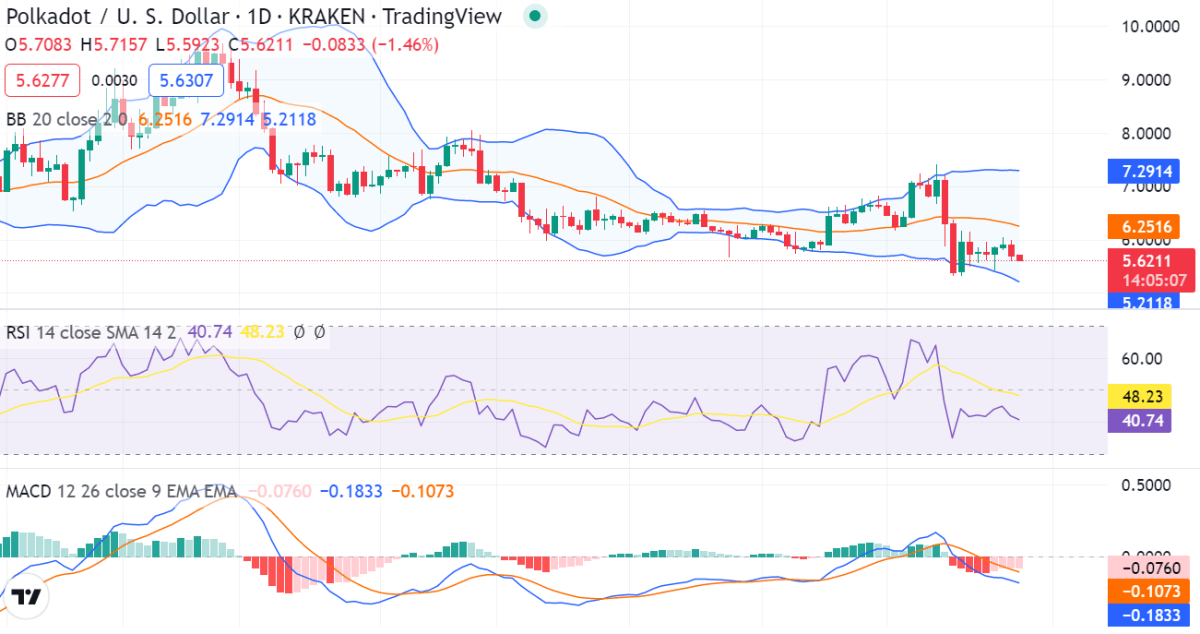
The one-day Polkadot price analysis indicates a negative trend for today given that the price has also decreased today. Over the last three days, the negative momentum has persisted, and today’s trend is the same. After the most recent decline, the price has dropped to the $5.67 mark. The cryptocurrency pair has lost 3.21 percent of its value in the most recent few hours.

The MACD indicator is currently in the bearish momentum as the signal line(red) is above the MACD line(blue). The Bollinger band indicator reveals expanding bands hence increasing volatility. The upper band is currently at $7.29 and the lower band is at $5.63. The DOT/USD price is currently very close to the lower band which could bounce back prices soon. The relative strength index(RSI) Indicator for DOT/USD is currently at 48.23 indicating assets are stable and are falling into the lower neutral region.
DOT/USD 4-hour price chart: Latest developments
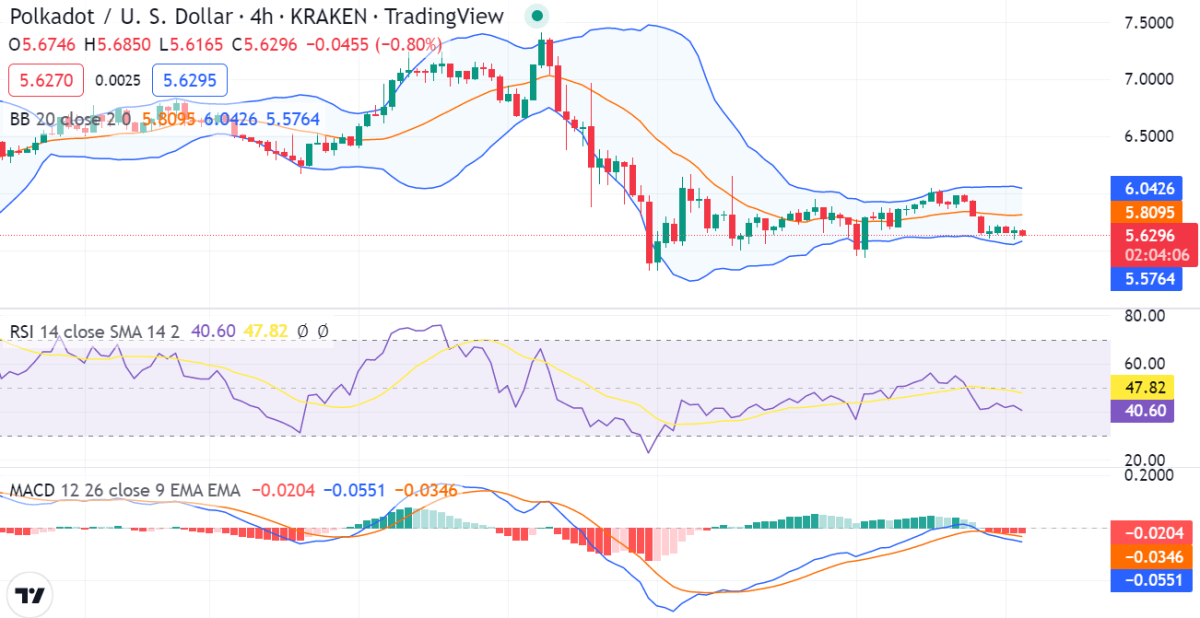
The 4-hour Polkadot price analysis shows market volatility following an opening movement. This indicates that Polkadot’s price is getting more susceptible to swings in either direction and exhibiting more falling characteristics. The upper boundary of Bollinger’s band is set at $6.04, while the lower boundary is set at $5.57, which is the current market price and the first level of support.

The RSI indicator shows that bears are in control of the market as it is currently below the 50 levels. The market is expected to remain bearish in the short term as the MACD indicator is moving below the signal line which is a bearish sign.
Polkadot price analysis conclusion
In conclusion, Polkadot price analysis indicates a decline in price today since the environment is negative for cryptocurrencies. The price has fallen to the $5.63 area due to the bears’ efforts to keep up their strong momentum. However, given that the positive momentum appeared to be returning over the last week, it is possible that it will rebound and push the price above the $5.87 mark.
Disclaimer. The information provided is not trading advice. Cryptopolitan.com holds no liability for any investments made based on the information provided on this page. We strongly recommend independent research and/or consultation with a qualified professional before making any investment decisions


