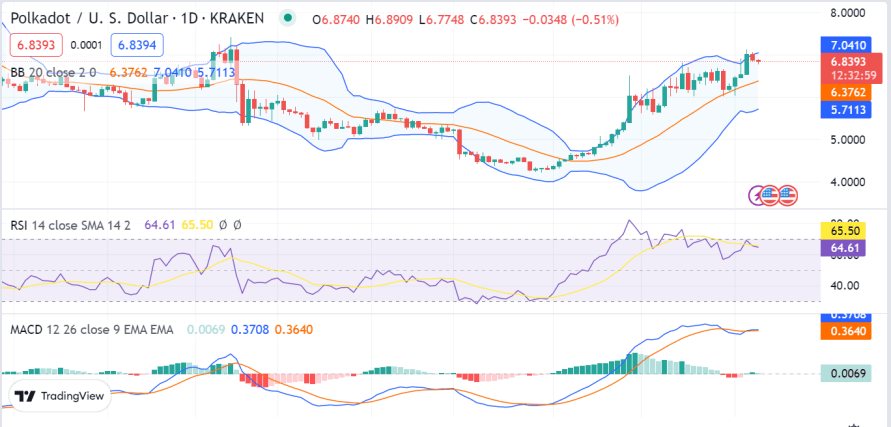
Polkadot price analysis has been facing a downward trend today as the bears are in control of the market and are likely to maintain their momentum. The bears have been looking to push the price lower and have been successful in doing so. The support level of $6.80 has been breached, and the price is currently trading at $6.86.The cryptocurrency’s value has dropped by more than 0.45%, and the short-term moving line is still in negative territory, indicating that the bears are in control. The market capitalization of DOT/USD is at $7.9 billion, while the daily trading volume has dropped to $213 million.
Polkadot price analysis on 1-day chart: DOT/USD faces bearish pressure at $6.86
The 24-hour Polkadot price analysis shows the price has decreased again after increasing earlier today. The DOT/USD pair is trading hands at 6.86 at the time of writing as the bears are leading the price function, the DOT shows a decrease in value by 0.45 percent over the last 24 hours.

The MACD indicator shows a bearish crossover in the 24-hour chart which indicates that the trend is bearish. The RSI is also trending downward and has dropped below the 70-level, indicating that the bears are dominating the market. The Bollinger Bands is increasing, suggesting that further downtrends are taking place as the volatility increases. The upper band of the Bollinger bands indicator is touching the $7.044 point, whereas their lower band is present at a $5.7099 margin.
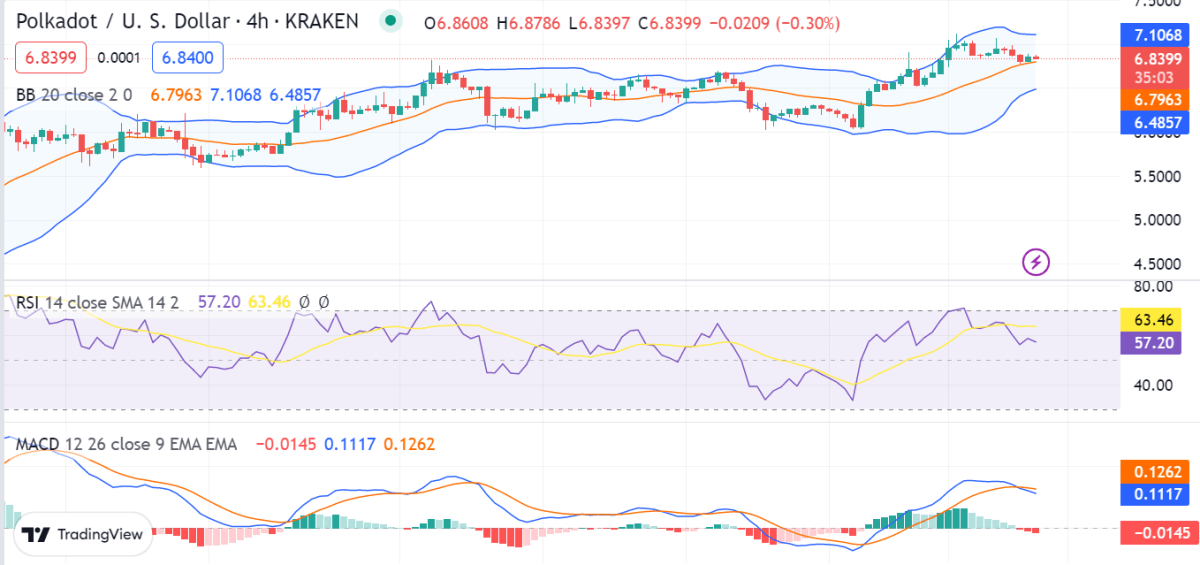
DOT/USD 4-hour price chart: Polkadot trades in a downward channel, with $5.56 acting as a significant resistance.
The 4-hour Polkadot price analysis shows that the DOT/USD has been in a downtrend for the last 24 hours. The price has dropped by more than 0.45% and is currently trading at $6.86. The next few hours of trading are crucial for the market as it is expected to break out of the recent consolidation. The market is expected to break out to the upside or downside in the near term. The bears are pulling down the price levels and are still succeeding in maintaining them, as the price has gone down to $6.86.

The moving average convergence and divergence (MACD) indicator show a bearish crossover, as the MACD line is below the signal line. The market’s volatility is increasing as Bollinger Bands expand, indicating that the trend is bearish. Its upper band shows its value at $7.1080, while its lower band shows $6.486, representing resistance and support, respectively. The relative strength index (RSI) is also decreasing and is currently at 63.53.
Polkadot price analysis conclusion
In conclusion, Polkadot’s price analysis shows that the bears are still in control of the market. The price has dropped by more than 0.45%, and the short-term moving line is still negative, indicating that the downtrend is still in play. However, the bearish momentum is powerful and has taken control of the market. A new low appears inevitable as the bulls have been crushed by intense selling pressure in today’s trading session. Additionally, the trend line has been broken, indicating that DOT price declines will continue.


