Polkadot price analysis is bullish, with the DOT/USD pair rising to the $6.29 level. However, the digital asset is facing resistance at this point and may pull back to test support at $6.12. The price action recently created a bullish engulfing candlestick pattern, which indicates that the bears are losing control. Currently, the price is just below the channel’s upper boundary at $6.30. A breakout above this level could see Polkadot target the next resistance level at $6.40. On the other hand, a failure to move past $6.30 may see the price pull back to test support at $6.12.
The trading volume has increased over the last 24 hours to retrace to $220,764,081 Therefore, the bulls need to be careful as a bearish move could invalidate the bullish trend, the Polkadot price is currently in a breakout zone and a move in either direction could set the tone for the next move. The market cap for the Polkadot price is currently at $7,058,073,702.
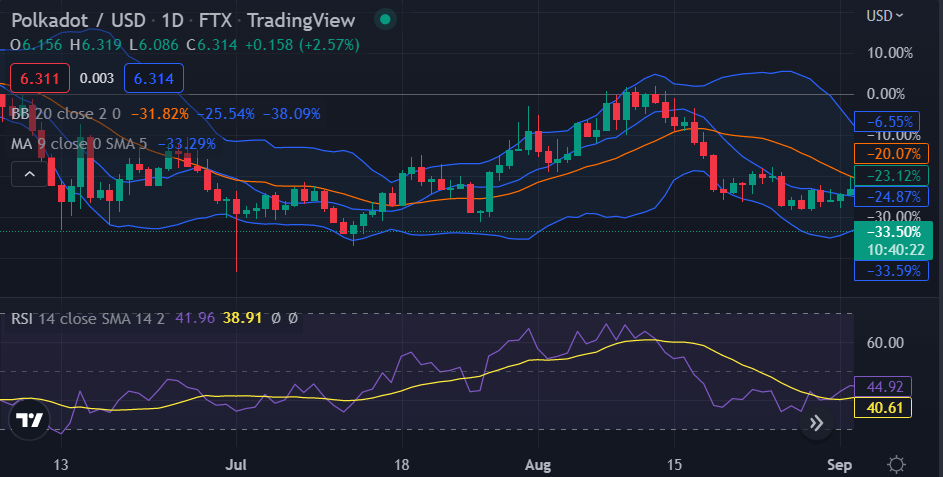
DOT/USD 1-day price chart: Bulls continue to dominate as Polkadot price nears $6.29
The 1-day Polkadot price analysis is displaying encouraging signs for the buyers and motivating them to further add to the asset value. Despite the previous week experiencing a downfall in price levels, the latest trends have proved positive for cryptocurrency. DOT price has reached $6.29 at the time of writing, gaining 1.33 percent value during the last 24 hours. In the past week, bearish superiority was observed, yet today, a commendable rise in price has happened as the coin is challenging the $6.30 resistance. This value is quite higher than the moving average (MA), which is $6.28.

The Relative Strength Index (RSI) score has also improved and has successfully attained the value of 40.61. The upper limit of the Bollinger bands indicator is now resting at $6.30, while its lower limit is resting at $6.12. At the same time, the Bollinger bands indicator displays an average of $6.30 below the current price level.
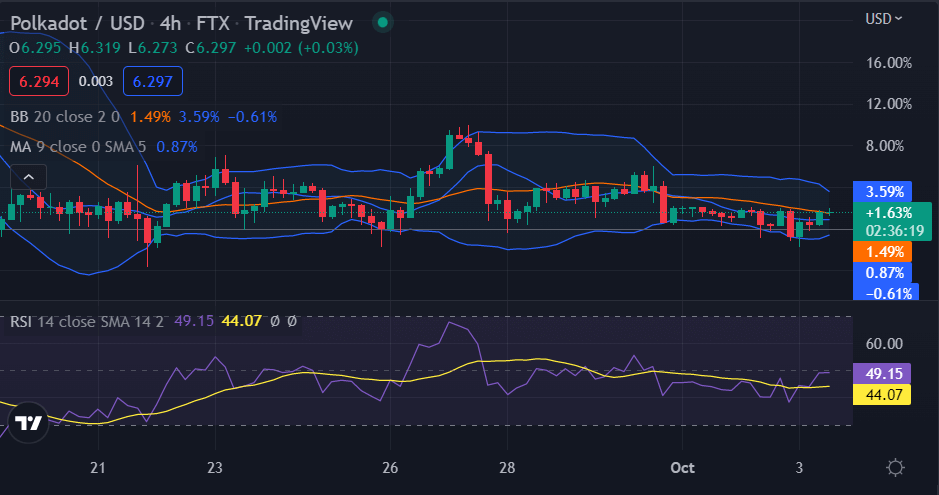
Polkadot price analysis 4-hour price chart: Price upgrades to $6.29 after bullish efforts
The 4-hour price chart for Polkadot price analysis shows that the cryptocurrency has encountered a bearish strike and has succeeded in breaking above the $6.30 level. The prices are trading along with the ascending channel and a breakout from the current range could set the tone for the next move. on the 4-hour price chart, the buyers are currently in control as the prices are trading above the moving averages.

The past week has proved very crucial for both the bulls and the bears, as both have showcased their strengths, but the current trend is going bullish for the cryptocurrency. The Bollinger bands are expanding, with the upper band going to $6.29, and the lower band is present at the $6.11 mark. The RSI score is also increasing and is currently at index 44.07, just near the border of the overbought region.
Polkadot price analysis conclusion
In conclusion, the one-day and four-hour Polkadot price analysis suggests an upward trend for the cryptocurrency as bulls are in the leading position. The bulls have managed to enhance the coin value to a $6.29 high point. The coin is expected to scale upwards as the buying activity is intense in the market, and the technical indicators are also in favor of the bulls.


