Polkadot price analysis reveals a bullish trend because there has been upward price movement during the past 24 hours. For the past few days, the market has been moving in a bullish direction, and the price has increased dramatically. Similar patterns were seen today as well, with the bullish momentum strengthening and regaining control of the market, pushing the DOT/USD value to a high of $5.23.As long as the support around $5.16 holds, the market is anticipated to continue its upward path. However, if prices fail to surpass the resistance at $5.24, the bears can make a comeback. The 24-hour trading volume for DOT/USD pair is currently at $161,719,003, and the market capitalization of $6,003,992,904.
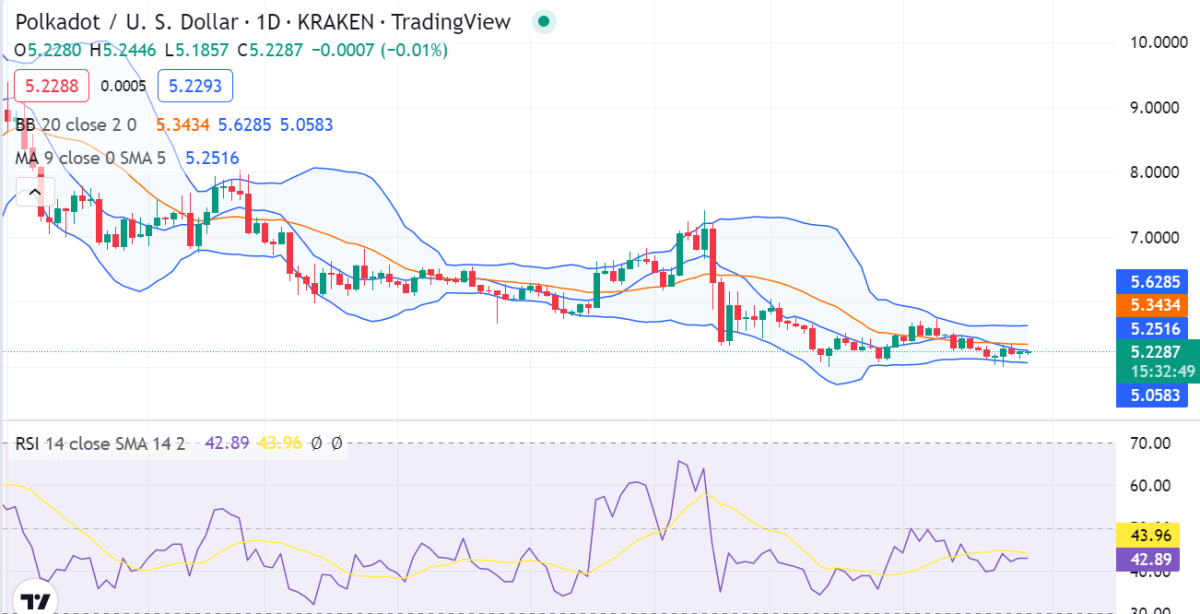
Polkadot price analysis on 1-day chart
The 1-day Polkadot price analysis is in an upward trend, according to analysts, and the bulls are still in control of the price chart as of right now. The buyers have greatly benefited during the last week. The price has grown up to the $5.23 level, earning 0.96 percent over the last 24 hours, demonstrating that today’s trend is once again positive. Polkadot price is extremely vulnerable to fluctuating shifts on either extreme as a result of the market’s increasing volatility. The Bollinger Bands’ upper value has moved up to $5.6285 as the price is trading above it, while its lower value is $5.0583 representing the strongest support.

The Relative Strength Index (RSI) is trading at 43.96, which indicates that the market is in overbought territory and bullish and is in control of the market. The 50 MA is above the 100 MA, which indicates that the bulls are in control of the market. This suggests that the bulls are getting stronger and will probably raise prices soon. The market is in a bullish trend and is most likely to keep heading upward, according to all of the technical indicators.
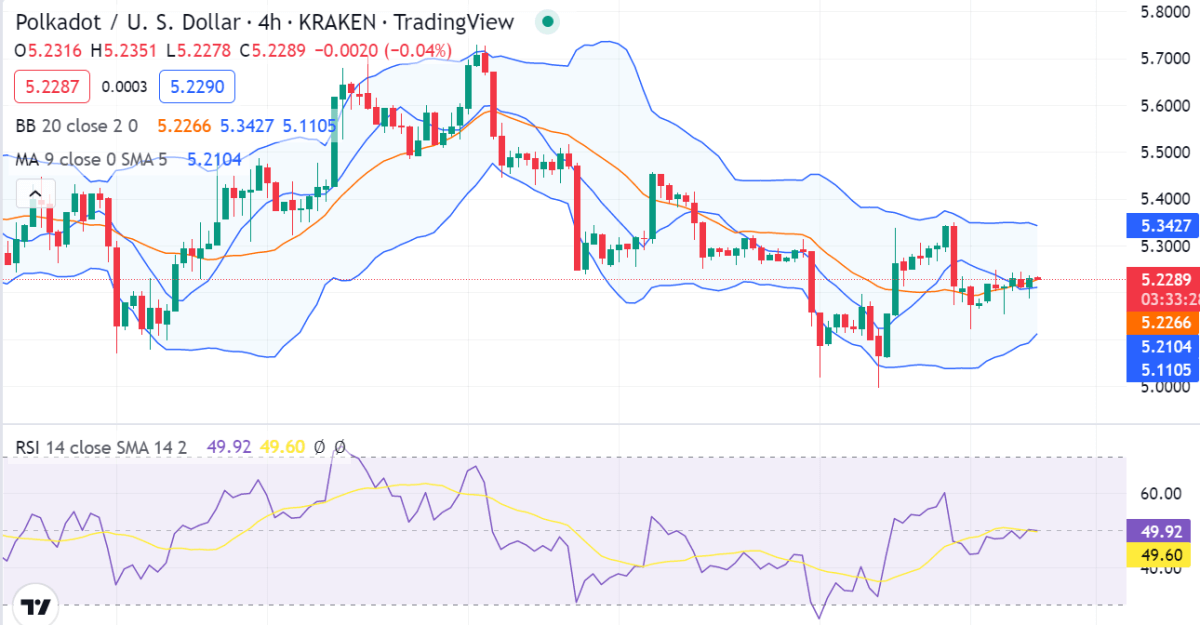
DOT/USD 4-hour price chart: Firm bullish sentiment forms
The 4-hour price chart for Polkadot price analysis shows there was a correction at the close of the previous trading session, it was quite slight and did not affect today’s price movement. The price has already recovered. Today’s buying activity increased, and as the price increased, buyers now control the market. The price has risen to $5.23, which is still above its moving average, which has settled around the $5.2104 level.

The Bollinger’s band’s upper limit is $5.3427, serving as DOT’s strongest resistance point. Conversely, the lower limit of Bollinger’s band is $5.1105, which is the strongest support point for DOT. The relative strength index is currently at 49.60 which has risen and is at an overbought area at the moment. The RSI indicator is currently increasing, indicating that the bulls remain in control of the market.
Polkadot price analysis conclusion
To conclude, Polkadot’s price analysis reveals that the price has changed drastically since yesterday. After continuous upgrades, the cost rose to $5.23 today. Strong bullish momentum is expected to persist and reach new highs in the short term.
Disclaimer. The information provided is not trading advice. Cryptopolitan.com holds no liability for any investments made based on the information provided on this page. We strongly recommend independent research and/or consultation with a qualified professional before making any investment decisions.


