Polkadot price analysis shows a downtrend in the market as the price function deflates down to $6.35. This bearish trend emerged as sellers regained control and the DOT/USD pair struggled to break above resistance at $6.54. However, support for the coin remains strong at $6.30, indicating a potential for a rebound in the near future.
The Polkadot market has been in a consolidation phase over the last few days as it trades between $6.25 and $6.55. The digital asset is currently trading at $6.35 and is down by over 2.57% on the day. The market cap for DOT is currently at $7.21 billion, and the 24-hour trading volume stands at $251 million.
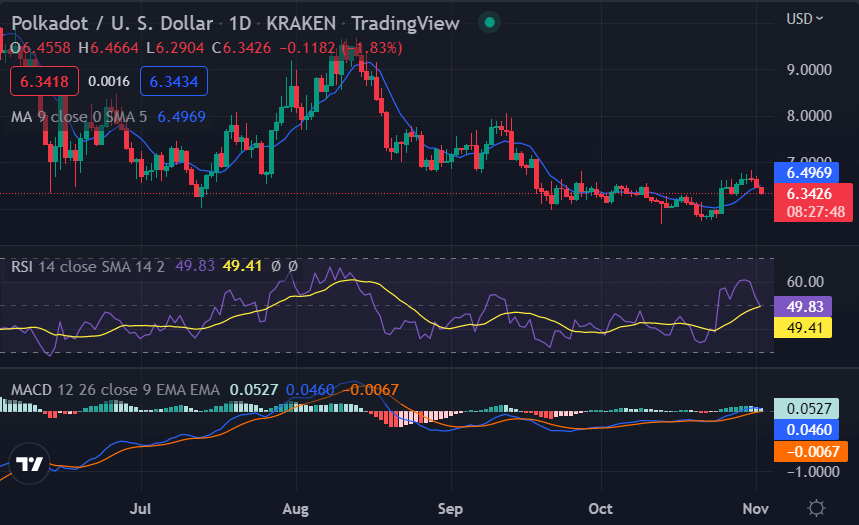
Polkadot price analysis 1-day price chart: Price sinks down to $6.35
The price is going down once again as a bearish trend has been confirmed from the one-day Polkadot price analysis. The DOT/USD pair is trading hands at $6.35 at the time of writing after being on the decline steadily since yesterday. The bulls initially managed to push the price up to $6.54, but the bears quickly took control and pushed the price back down.

The MACD indicates a strong bearish presence as it moves further into the negative region. The RSI is also showing bearish momentum as it falls below 50 on the indicator. Looking at the one-day chart, the price is currently below the 50-day and 200-day moving averages, indicating a bearish trend in the market. The Moving average indicator is currently at $6.49, which is below the current market price.
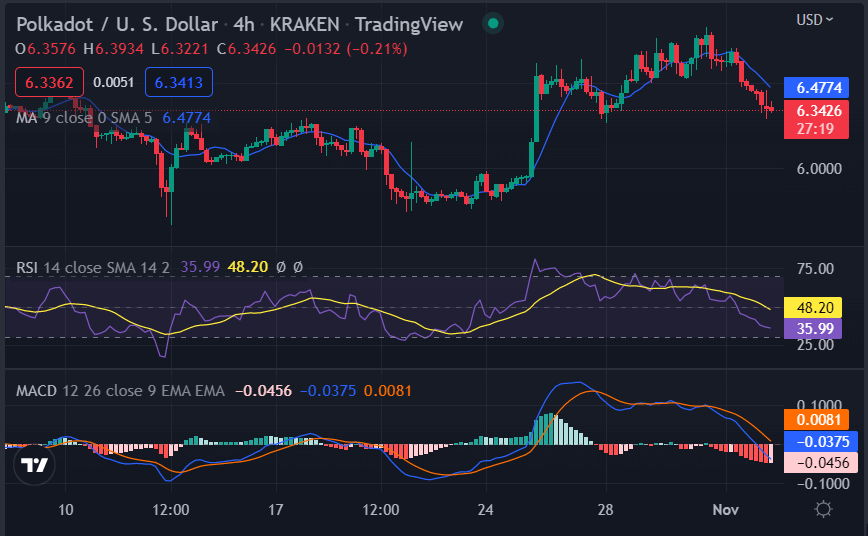
DOT/USD 4-hour price chart: Polkadot price is bearish at $6.35
The four hours Polkadot price analysis shows the support has appeared at $6.30 as the price has started to recover after being on a downfall for 4 hours. The downfall intensified immensely before the support arrived, which deteriorated the price levels drastically. However, the bullish return has helped to recover the price up to $6.54, and the moving average value is standing at $6.47 for now.

The RSI curve is now moving upwards as the buying process is reinstated, and the RSI level is now below 50 levels, as it is currently at 48.20. The MACD curve is also showing signs of a bullish trend, but it has not indicated any signs of an imminent price movement just yet.
Polkadot price analysis conclusion
The price is headed down once again, as has been confirmed from the one-day and four-hour Polkadot price analysis. The price has followed a downward movement today because of the bearish trend dominating the market. The bears were in the driving seat for the past 24 hours, and the DOT/USD pair struggled to break above resistance at $6.54. However, support remains strong at $6.30, and there is potential for a rebound in the near future.
Disclaimer. The information provided is not trading advice. Cryptopolitan.com holds no liability for any investments made based on the information provided on this page. We strongly recommend independent research and/or consultation with a qualified professional before making any investment decisions.


