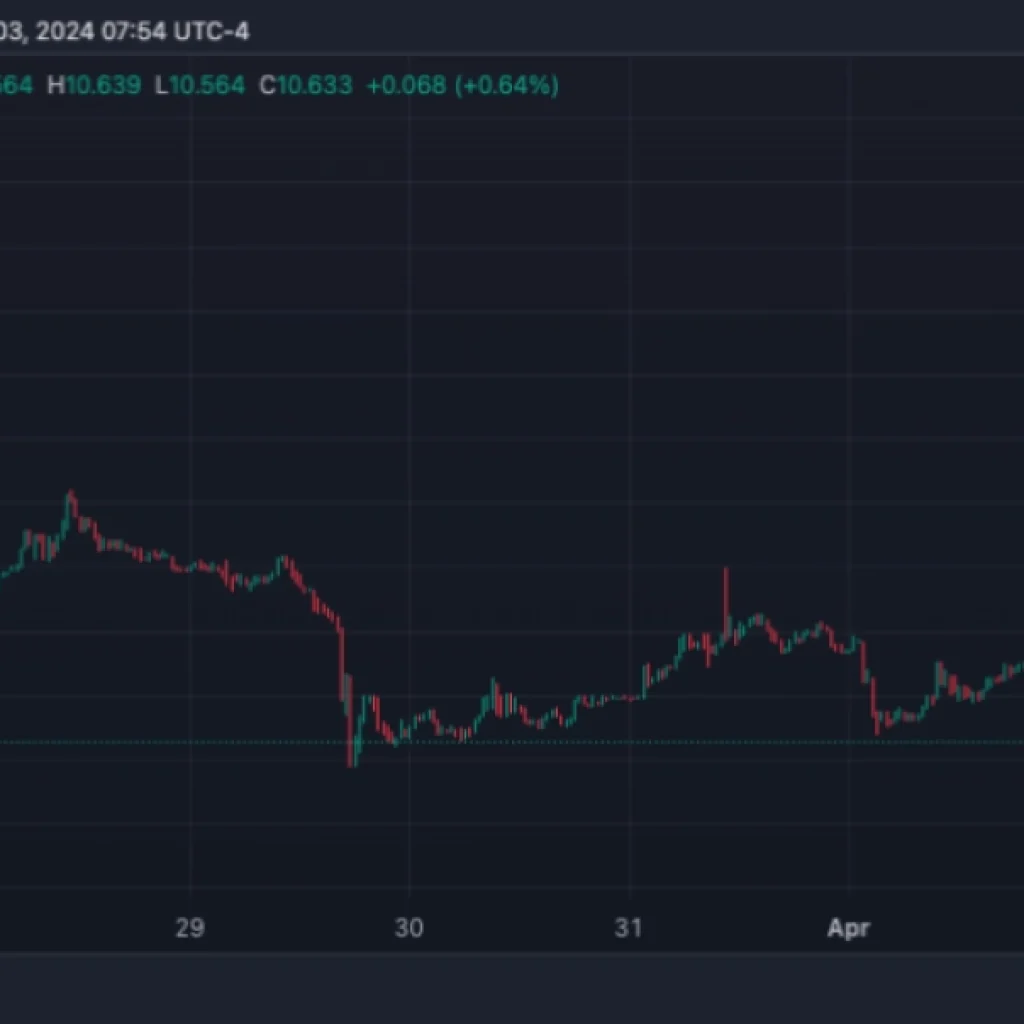
Bitcoin is giving off fresh signals that it is soon time for a BTC price surge, but old support may need a retest first.
Bitcoin (BTC) continues to tread water at the April 10 Wall Street open, but crypto market participants are betting on a serious breakout next.
After a late surge took BTC/USD to its highest weekly close since June 2022, there is new optimism over an attack on $30,000.
Data from Cointelegraph Markets Pro and TradingView shows a cool start to the macro trading week, with $28,200 currently forming a focus.

With formidable resistance overhead, however, Bitcoin has spent much of the last week in a firmly established but increasingly narrow trading range.
The longer this holds, the theory goes, the more intense the eventual breakout should be — whether up or down.
Cointelegraph takes a look at some popular analysts’ outlooks when it comes to what BTC price action will do next.
Material Indicators: Will Bitcoin “pop or drop?”
Order book data plays a key role in determining flash price moves, and the latest figures from Binance warning that volatility is incoming.
A snapshot uploaded to Twitter by monitoring resource Material Indicators shows that both buy side and sell side liquidity are being removed from near spot price to lower and higher levels, respectively.
This in turn gives the market room for more erratic moves within its range, increasing the potential for a more substantial trend break.
“It's going to be an interesting week. FireCharts shows pathways to volatility are clearing in both directions. The question is, will BTC pop or drop after all of this chop?” Material Indicators commented.
“CPI and PPI reports this week could be catalysts, but so could liquidity being pulled as we saw yesterday before the W candle close.”

Credible Crypto: BTC price copying 2020 breakout
For popular trader Credible Crypto, Bitcoin is reenacting a bullish preparatory structure from just before it broke through its old $20,000 all-time high in late 2020.
$26,000-$29,000 today is “incredibly similar” in terms of price behavior to the $8,000-$10,000 range from summer of that year, he argues.
In a perfect world, BTC/USD would dip to around $27,500 to consolidate that area as support before a bullish surge higher, an accompanying chart illustrates.

As Cointelegraph reported, Credible Crypto is not the only market participant eyeing similarities to Bitcoin bull runs of old, with 2019 also forming a focus.
Stockmoney Lizards: "Decision point" for Bitcoin
Financial information resource Stockmoney Lizards meanwhile believes that the overwhelmingly likely outcome of the current rangebound period is “up.”
Related: CPI to spark dollar ‘massacre’ — 5 things to know in Bitcoin this week
In its latest chart prediction, it highlighted BTC/USD making a series of higher lows while preserving the same cloud of resistance near $30,000.
This, it believes, will result in bulls winning out, as Bitcoin arrives at a “decision point.”

Analysis released the same day reinforces the idea that if a resistance level “has been tested x times and hasn't broken, it may be a sign that the level is weakening and a breakout is more likely.”
The views, thoughts and opinions expressed here are the authors’ alone and do not necessarily reflect or represent the views and opinions of Cointelegraph.


