Ripple price analysis shows a bearish trend for today. The bears have taken over the price charts once again and have reduced the price level to 0.464, as market sentiment is bearish towards XRP/USD. Selling pressure came in at the start of today’s trading session, but the trend remained undetermined during the first four hours, and after that, bears outplayed the bulls.
The price trend line shows a downward curve for today. The support level for XRP/USD is present at $0.4621. If the price falls below this level, it may continue to decline toward lower support levels at $0.45 and $0.44. On the other hand, if the bulls manage to push back and increase buying pressure, the next resistance level for XRP/USD is $0.478.
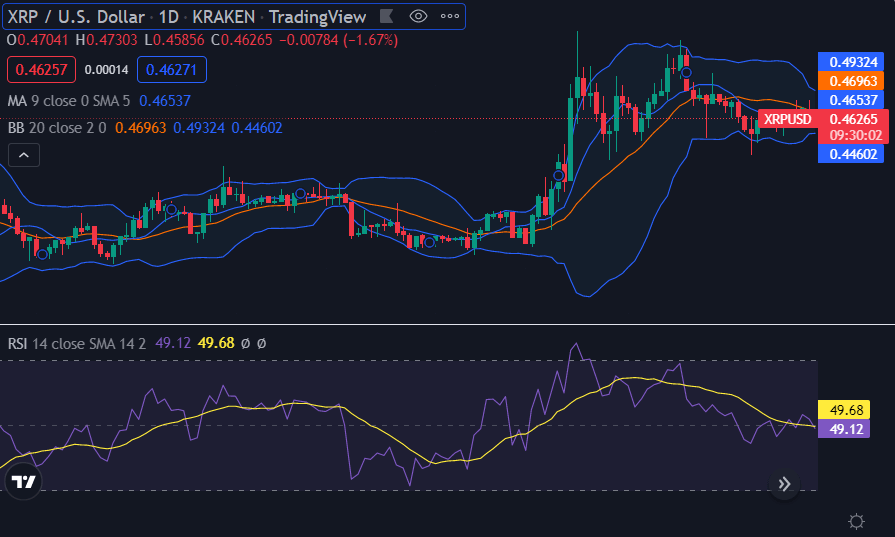
Ripple price analysis 1-day price chart: Price goes down to $0.464
The 1-day price chart for Ripple price analysis shows the price breakup was downwards today and continues to go down as of now, and the XRP/USD pair is trading hands at 0.464 at the time of writing. The price trend was downwards from yesterday’s, and today the price seems to be sliding sideways. The trading volume for XRP/USD today is at $1.31 million and has a market cap of $23 billion.

The volatility is increasing for XRP/USD as the Bollinger bands are expanding with the upper side of the indicator readjusting itself to $0.4932, and the lower band has come down to $0.4460 representing support for XRP as the price is trading near the lower band. The mean average line of the Bollinger bands is still above the price level at the $0.4696 mark. The relative strength index (RSI) is hovering in the neutral zone. RSI is present at index 49.68but sinking slowly, indicating a selling activity gaining strength in the market.
Ripple price analysis: Recent developments and further technical indications
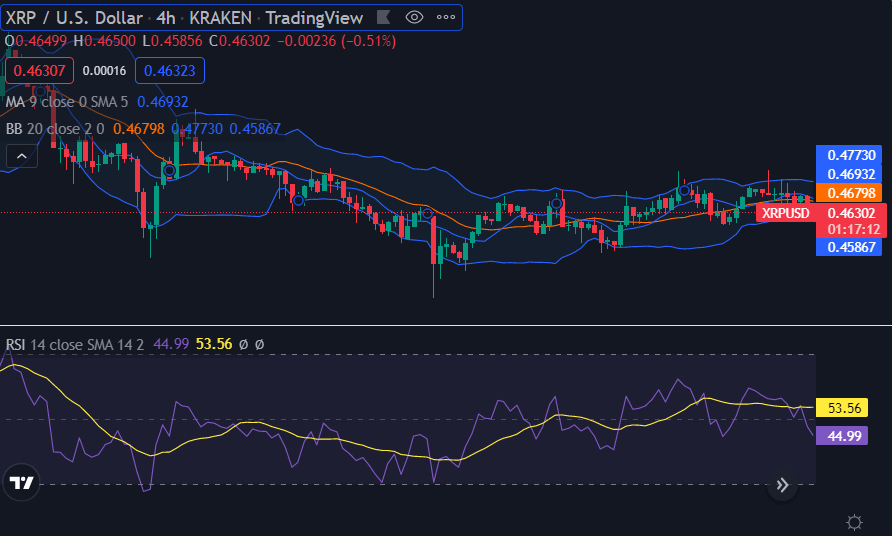
The 4-hour price chart for Ripple price analysis supports the bears as the price has covered a downward movement in the past few hours. The price breakout was upwards, but at the start of the trading session, as bulls tried to recover during the late hours yesterday; however, the descending curve confirms a bearish trial as a red candlestick appeared on the hourly price chart. The bearish momentum intensified as the price dropped down to a $0.464 low. The short-term trending line is also moving in the bearish direction now. On the other hand, the moving average mentioned in the four-hour price chart stands at $0.4693.

The volatility is seemingly high, which means that the ongoing downtrend may extend within the next few hours. The Bollinger band indicator’s values have shifted as thus that now the upper value is $0.4773, whereas the lower value is $0.4586 The RSI score moved to an index of 53.56 because of the downward wave continuing for the past few days. The coin is still undersold on the 4-hour chart, and the RSI curve is flat, hinting at a lack of bearish momentum, but the bearish pressure still weighs on the price function.
Ripple price analysis conclusion
To sum up the Ripple price analysis, the bearish momentum has arrested the XRP/USD pair’s function at $0.464, and the trend is strongly bearish for the short term. The price may fall towards lower support levels if selling pressure continues to dominate. The daily and hourly technical indicators also support the ongoing bearish trend.
Disclaimer. The information provided is not trading advice. Cryptopolitan.com holds no liability for any investments made based on the information provided on this page. We strongly recommend independent research and/or consultation with a qualified professional before making any investment decisions.


