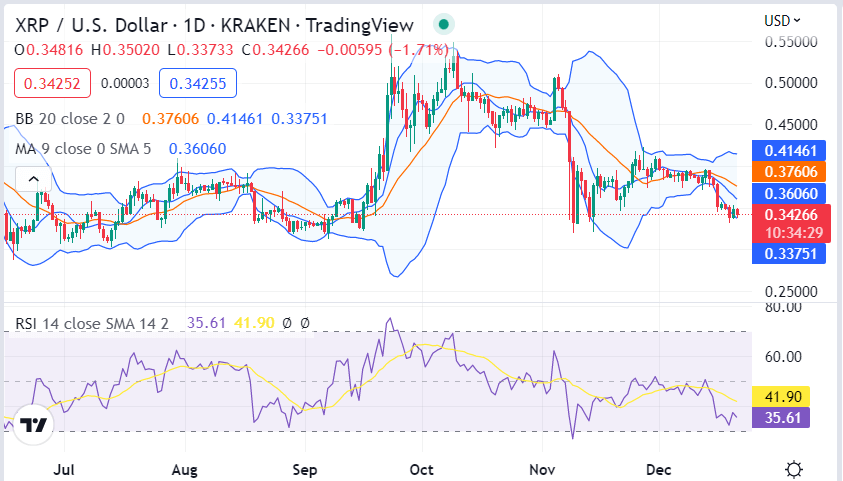
Recent Ripple price analysis has been bearish as the cryptocurrency has fallen below a key support level. The digital asset is currently trading at $0.3429 and is down by 0.44 percent in the last 24 hours. Support for XRP/USD is present at $0.3397 while resistance lies at $0.3528. The 24-hour trading volume for the coin is $800,387,451 and the market capitalization is at $17,248,296,779.
The digital asset has been on a downtrend since the beginning of today as it failed to break out above the $0.3528 level. The digital asset has been consolidating around this level over the past few days but today, it has broken below this level. This move has invalidated the previous bullish setup and has put the digital asset on a bearish path in the short term.
Ripple price analysis for 1 day: Market squeezes tighter
Ripple price analysis on a 1-day price chart shows that the XRP/USD price is trapped in a descending triangle pattern that it has been following for the past few days. The bulls have been trying to push the price above the $0.3528 level but have been unsuccessful so far. The bears have taken control of the market and are currently pushing the price toward the $0.3397 support level.

The moving average indicator is bearish as the 50-day moving average is below the 200-day moving average. This indicates that the market is in a downtrend. The RSI indicator is currently at 41.90 and is indicating further bearish momentum in the market. Both Bollinger bands are contracting, which indicates that the market is reaching a period of low volatility.
XRP/USD 4-hour price analysis: Latest developments
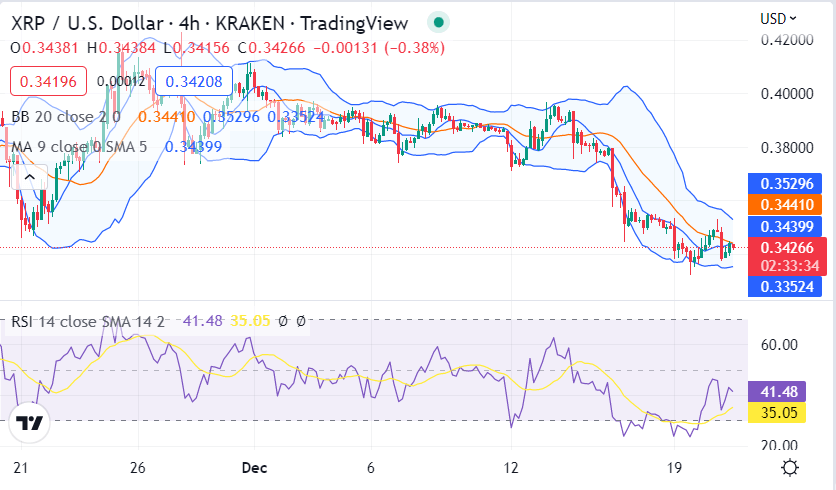
Ripple price analysis has revealed that market volatility shows increasing dynamics, making market vulnerability a priority. As a result, the cryptocurrency’s price will become more sensitive to unpredictable and unstable surges of volatile change. The upper limit of Bollinger’s band is present at $0.0.3528, which acts as a strong resistance for XRP. Conversely, Bollinger’s band limit’s lower limit is available at $0.3397, representing the strongest support for XRP.

The XRP/USD price seems to be crossing under the Moving Average curve, indicating a bearish trend. Furthermore, the price path appears to be following a downward direction signifying a decreasing market. However, the market shows potential for further bearish opportunities, and bears might engulf the market soon. The Ripple price analysis reveals that the Relative Strength Index (RSI) is currently at 35.05 and is neutral.
Ripple price analysis conclusion
Overall, the Ripple price analysis is bearish as the digital asset has fallen below a key support level, and a break below this level could lead to further downside in the market as XRP looks to test the $0.3397 level. The bulls will need to push the price above the $0.3528 level for the market to turn bullish in the short term. Until then, the bears are in control of the market and a further move to the downside is likely.


