Ripple price analysis shows a slight downward trend in current market conditions. The crypto is trading at $0.4550, at the time of writing. Prices have been trading between $0.45 and $0.47 over the past 24 hours. The next few hours may see upward price movement as the bears take a breather, but any rallies are likely to be short-lived as the overall trend remains bearish.
The XRP/USD pair is bearish today as the price reaches a low of $0.4534, after failing to sustain above the $0.471 resistance level. The bears are in control of the market and are likely to push prices lower in the next few hours. The most recent attempt at a corrective rally occurred last week, but this too was sold into, leading to the current decline. The price has now broken below the $0.4534 support level and looks likely to continue falling.
XRP/USD 1-day price chart: Bearish pressure overwhelms the market
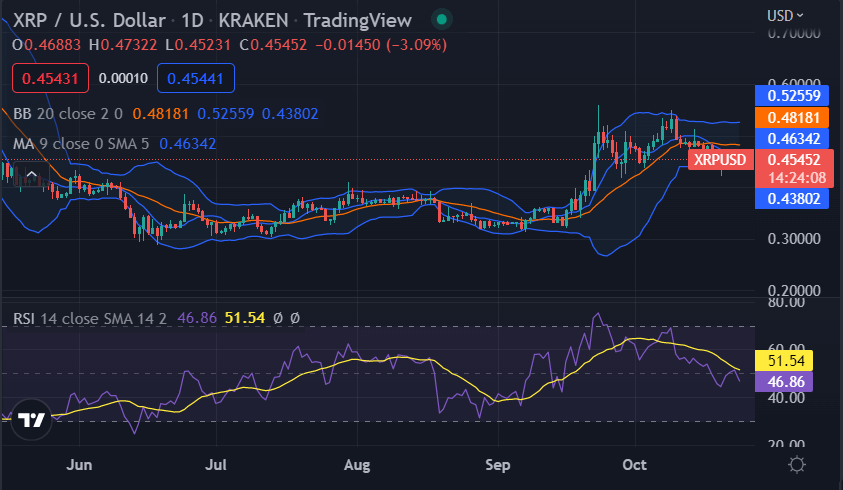
The 1-day price chart for Ripple price analysis shows a massive amount of value loss today. Bears covered an extensive downwards range from $0.44 to $0.48 past week, as the price of XRP/USD is trading at the later value at the time of writing. XRP/USD lost a value of more than 1.20 percent during the last 24 hours, and the Crypto pair reports a high loss of 2.63 percent over the past week, as another market crash is being observed today.

The Bollinger bands are present at $0.4380 just below the price level. The moving average (MA) is trading at $0.463 as the SMA 20 curve continues to trade below the SMA 50 curve. The relative strength index (RSI) is trading in the underbought zone today again and is still on a downwards curve at index 51.54, hinting at the selling activity due to extreme bearish pressure in the market.
Ripple price action on a 4-hour price chart: Recent updates
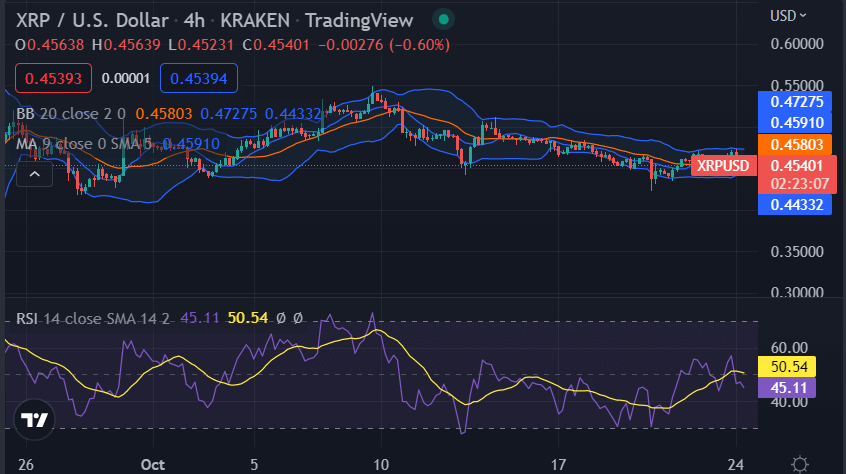
The 4-hour timeframe for the Ripple price analysis shows that the bears have been in control of the market for the last 4- hours. The price is currently trading below the $0.471 resistance level and looks likely to continue falling. The XRP/USD price appears to be crossing under the curve of the Moving Average, which is a bearish signal. The Relative Strength Index (RSI) is currently at 39.32 and is moving below the 50 level, which indicates that the market is bearish.

The 4-hour chart also shows an increase in volatility for the crypto pair. The upper Bollinger band has reached $0.472, and the lower band is present at $0.4534. The MA is also trading at $0.4591 above the price level. The RSI has also been maintaining its downwards curve near the underbought region as it has reached down to index 50.54 due to the continuous bearish activity.
Ripple price analysis conclusion
The Ripple price analysis shows the XRP/USD price trend line if observed from the last week, is on a downwards curve, so a further decrease in price can be expected in the coming days. For the coming hours, the price may continue to correct for a few hours more as it has reached near the support of $0.4534.
Disclaimer. The information provided is not trading advice. Cryptopolitan.com holds no liability for any investments made based on the information provided on this page. We strongly recommend independent research and/or consultation with a qualified professional before making any investment decisions.


