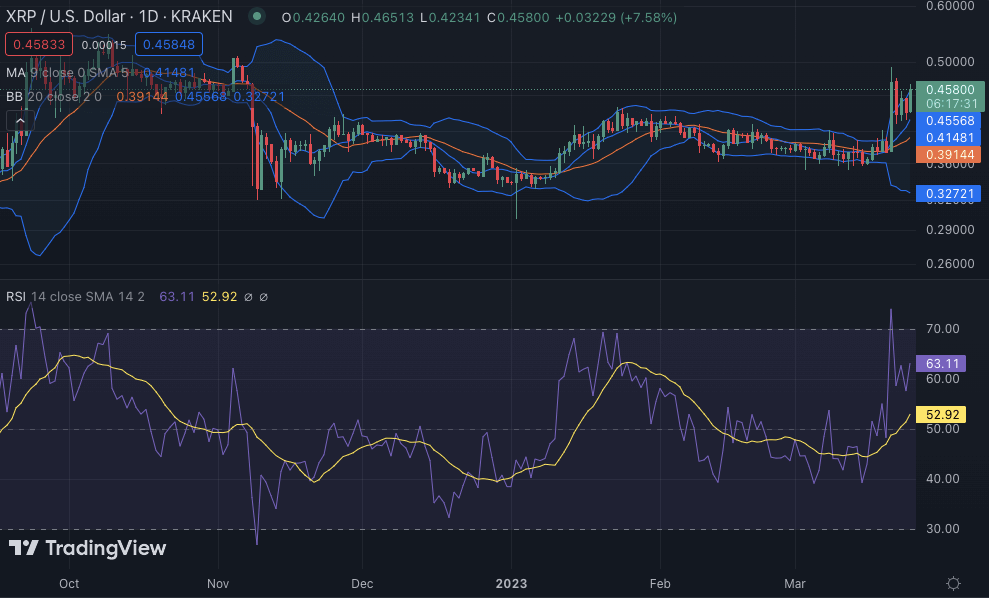
The Ripple price analysis gains momentum as the bulls have pushed XRP/USD to $0.4595 from the opening value of $0.418 in a few hours. The cryptocurrency gained 8 percent on the day, and it is well supported above the key level at $0.418, which was a crucial support level during the early trading day.
The XRP opened today trading in a bearish trend around $0.4238, as the selling pressure was strong from the beginning. Despite this, bulls managed to push the price higher and broke above the $0.4500 resistance level. The buyers extended their gains in the following hours and breached the resistance at $0.4636 and reached a high of $0.4607 before consolidating around current levels.
XRP/USD 1-day price chart: Bullish recovery is on the way as price levels rise to $0.4595
The one-day Ripple price analysis is confirming an upward trend for the crypto pair, as the bulls have been leading the price chart even today. The past few weeks have proved to be quite favorable for the buyers. Today’s trend has yet again proved to be on the supportive side, as the price has increased up to the $0.4595 level gaining 8 percent value during the last 24 hours.

Meanwhile, the moving average (MA) value has been trading at $0.414 as well, suggesting a positive sentiment for the XRP asset. Furthermore, Bollinger bands are also indicating a positive trend for the crypto pair on the daily chart. The upper band is located at $0.455, while the lower band is placed at $0.0.3272. The RSI indicator is also suggesting bullish momentum as it currently stands at 63.11 level.
Ripple price analysis: Recent developments and further technical indications
The 4-hour price chart for Ripple price analysis shows the price has undergone a recovery today, but a correction has also started during the past few hours. The buying momentum intensified for the first eight hours of the trading session, and the price even jumped high towards $0.4595 for a moment, which is the current trading value.

The Stochastic RSI oscillator is pointing to a rebound in progress as it stands at 64.78, indicating a neutral sentiment for the XRP/USD pair. The moving average indicator is currently at $0.4381, suggesting a bullish trend for the crypto pair on the 4-hour chart. The Bollinger bands are also indicating a positive sentiment, with the upper band located at $0.4623 and the lower band located at $0.4111.
Ripple price analysis conclusion
The Ripple price analysis suggests that the bulls are in control at the moment, and the crypto pair will likely continue to move higher as long as buyers remain in control. However, if a major correction occurs, then XRP/USD may hit the $0.418 support level once again. The technical indicators are favoring the buyers for now, so investors should look to capitalize on the current bullish momentum and buy at the current price level.


