According to the Solana price analysis, bears are currently in control of the SOL/USD market. As the bearish tendency has been steadfast for the past few days and has been consistently dominating the price function, a decline in price has been seen today as well.
Since February 21, 2023, the SOL/USD has been declining as bears have maintained their dominance, and the only feeble bullish efforts that have been observed have only been on an hourly basis. Overall, bears have been in charge and the coin value has considerably declined.
SOL/USD 1-day price chart: Price suffers as bearish pressure persists
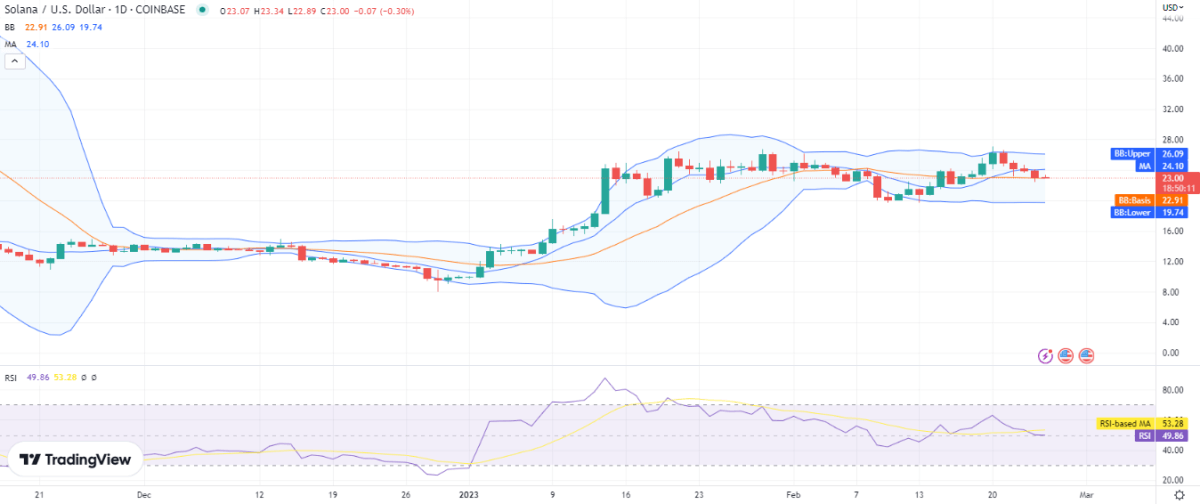
The 1-day Solana price analysis chart reveals that after yesterday’s slight bullish activity, which was seen during the last eight hours of the previous trading session, bears have once more assumed control of the price function today. The SOL/USD pair is currently changing hands at $23 and is trading in a constrained band between $22.92 and $23.36.

The volatility is mild for the cryptocurrency, with the upper Bollinger band at $26.09 and the lower band at the $19.74 mark; the average of the Bollinger bands is forming at the $22.91 mark, below the price level and the moving average (MA) which is present at the $24.10 mark.
The relative strength index (RSI) is hovering at index 49, in the middle of the neutral zone. The indicator is neutral because there isn’t much buying or selling going on, but the mid-range of the indicator gives both bullish and bearish market participants plenty of room to engage in aggressive selling that could push the price even lower.
Solana price analysis: Recent developments and further technical indications
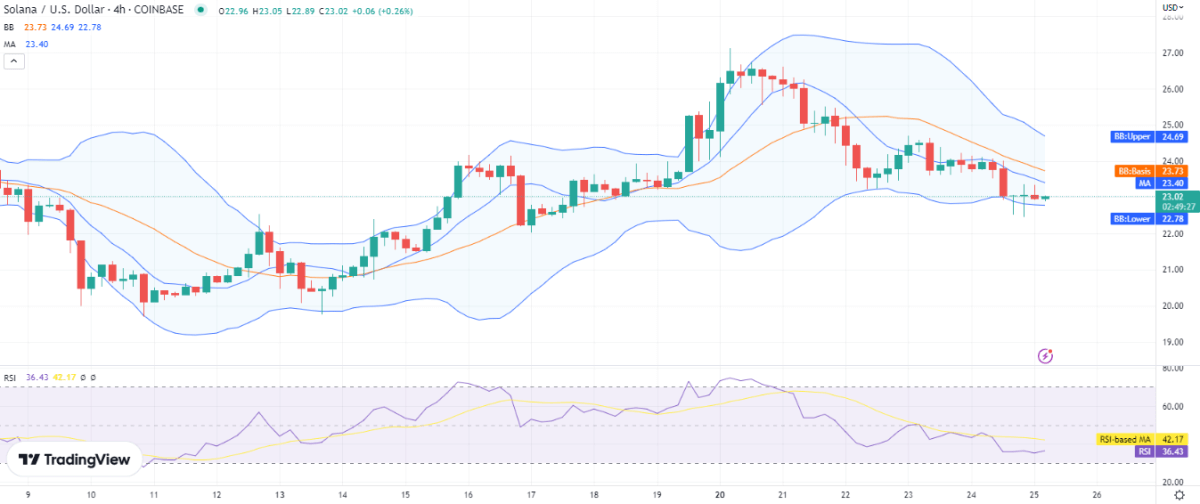
The bearish trend is further supported by the Solana price analysis 4-hour price data. At the beginning of the current session, the price broke out downwards. Bears were able to successfully divert the price function, and the price began falling once more. However, now that the price has been covering range upwards for the past four hours, bulls are attempting to make a comeback. Bulls have increased the price to $23.02 in an effort to halt further declines and to provide support.

The relative strength index (RSI), which is currently at index 36, has dropped into the lower levels of the lower half of the neutral zone on the 4-hour chart, where volatility has only marginally decreased. The RSI indication is crucial right now because the price will rise or fall in accordance with the movement of the indicator. This should be kept in mind, particularly for intraday trading.
Solana price analysis: Conclusion
According to the Solana price analysis, the price of the SOL/USD pair may decrease even more as the current state of the market implies. While the recent bullish efforts are encouraging, it is not likely that the current trend will alter anytime soon.


