Solana price analysis shows a downtrend in the cryptocurrency markets over the past 24 hours. For a while, the market has been dipping and it appears that this pattern could carry on in the short term. The biggest price point SOL/USD could rely on is $13.45 if this level gives way, then we might see more bearish movement. However, there is some resistance at around $13.77, which could also pose a challenge for the price of this cryptocurrency.
The digital asset, currently sitting at $13.53, has a market capitalization of $4.95 billion and a 24-hour trading volume of $238 million. On the last day, it is down 0.44%, making it the 16th largest cryptocurrency by market cap.
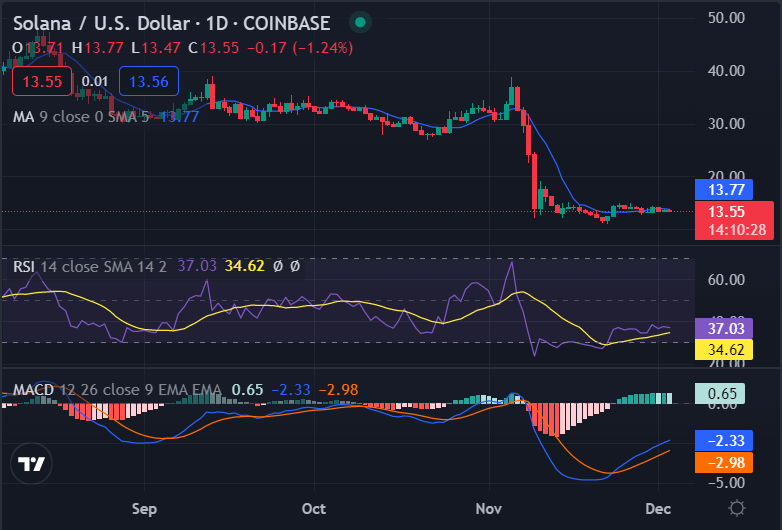
SOL/USD 1-day price chart. Solana has lowered its price to the $13.53 range
Solana’s price analysis over the past 24 hours shows that the bulls were in control at the start of the day yesterday, pushing prices up over $13.77. However, this was short-lived and a retracement soon ensued, taking prices down to around $13.45. This level seems to be holding steady, with the price of Solana likely to remain within this range in the short term.

The SOL/USD price appears to be crossing under the 200-day moving average (blue line), which is a bearish sign. The market is also trading below the 50-day moving average (yellow line). The RSI for the pair is currently at 41, which indicates that the market is in bearish territory. The MACD for the pair is currently in the bearish territory as well.
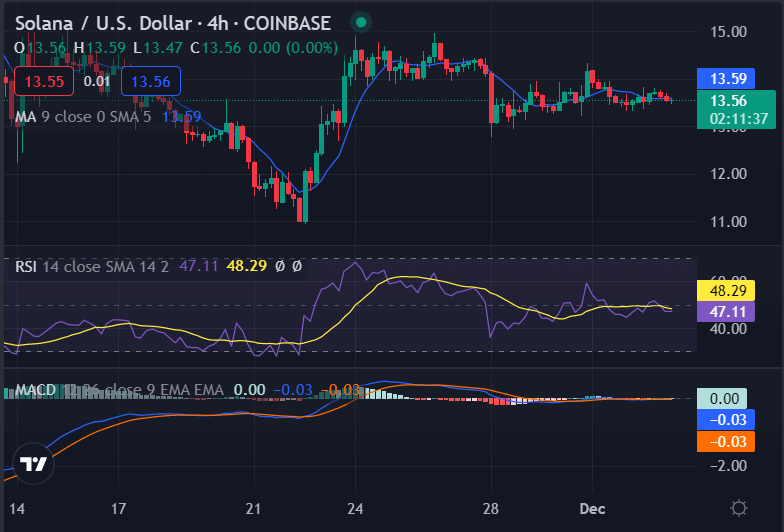
SOL/USD 4-hour price analysis: Solana (SOL) is trading around $13.53.
The 4-hour Solana price analysis chart shows that the cryptocurrency is under selling pressure and could see a further dip in prices. The decrease in volume over the past few days indicates that the market might be starting to lose momentum, which could potentially push prices lower in the short term.

The market has been facing rejection at the $35.64 level, and a break above this level is needed for the bulls to take control of the market. The next major resistance level for SOL/USD is present at the $37.00 level. The MACD line is currently below the signal line, which is a bearish sign. The RSI for the pair is currently below 50, which indicates that the market is in bearish territory. The 50-moving average is currently below the 200-moving average, which is a bearish sign.
Solana price analysis conclusion
Overall, Solana’s price analysis shows that the cryptocurrency markets are in a downtrend, and they could face further bearish pressure over the coming days. In order to regain some of its lost momenta, Solana will need to break above key resistance levels at $13.77. However, there is still room for short-term price fluctuations in this dynamic market.
Disclaimer. The information provided is not trading advice. Cryptopolitan.com holds no liability for any investments made based on the information provided on this page. We strongly recommend independent research and/or consultation with a qualified professional before making any investment decisions.


