Solana price analysis for today suggests that the bulls have lost their dominant hold over the market. The bears have been ruling the SOL/USD price chart for the past few days, as the price has been constantly experiencing a fall. The price underwent considerable decline even today, as the bearish trend brought it down to the $24.01 extreme. This has created chances of the price going into the danger zone, as the bearish trend has been expanding at a constant rate.
The previous day the bulls were ruling, however, the situation has turned upside down today. The $25.38 resistance level was breached by the bears, and this led to a further decline in the price. As of now, the strong support that is present at $23.76 is acting as an obstacle against any further downfall of the value of the Solana token.
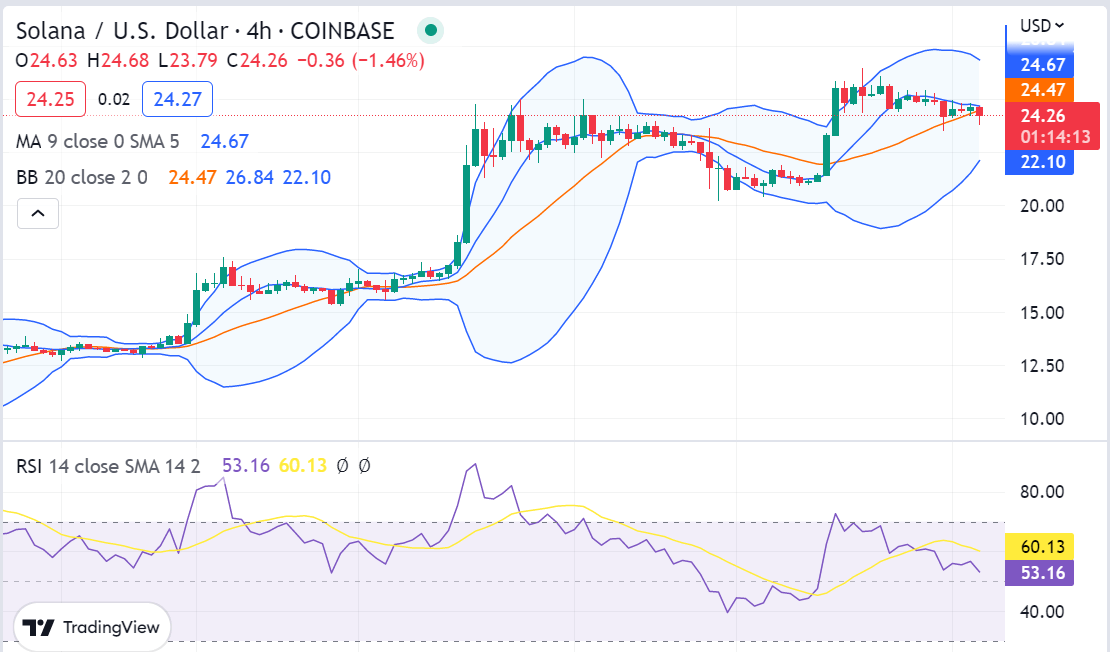
Solana price action on a 4-hour price chart: Resistance at $25.38 is currently limiting upward momentum
The 4-hour timeframe for the Solana price analysis shows that the bears have been in control of the market for the last 4- hours. The price is currently trading below the $25.38 resistance level and looks likely to continue falling. The bulls may take control of the market if prices manage to sustain above the $25.38 resistance level. However, the descending channel formation is forming a strong bearish trend and hence the price looks likely to remain in the danger zone for some time. The moving average(MA) value has also been declining at $24.67 with the recent bearish trend.

The Relative Strength Index (RSI) for Solana has been showing bearish signs since the start of this week, which implies that traders should be cautious when trading SOL on the market as it may cause losses if not done with caution. The volatility of the Solana market has also been decreasing with time and hence, traders should adjust their trading strategies according to the current market conditions. The Bollinger bands have been expanding on the 4-hour timeframe and this indicates that more volatility can be expected in the near future.
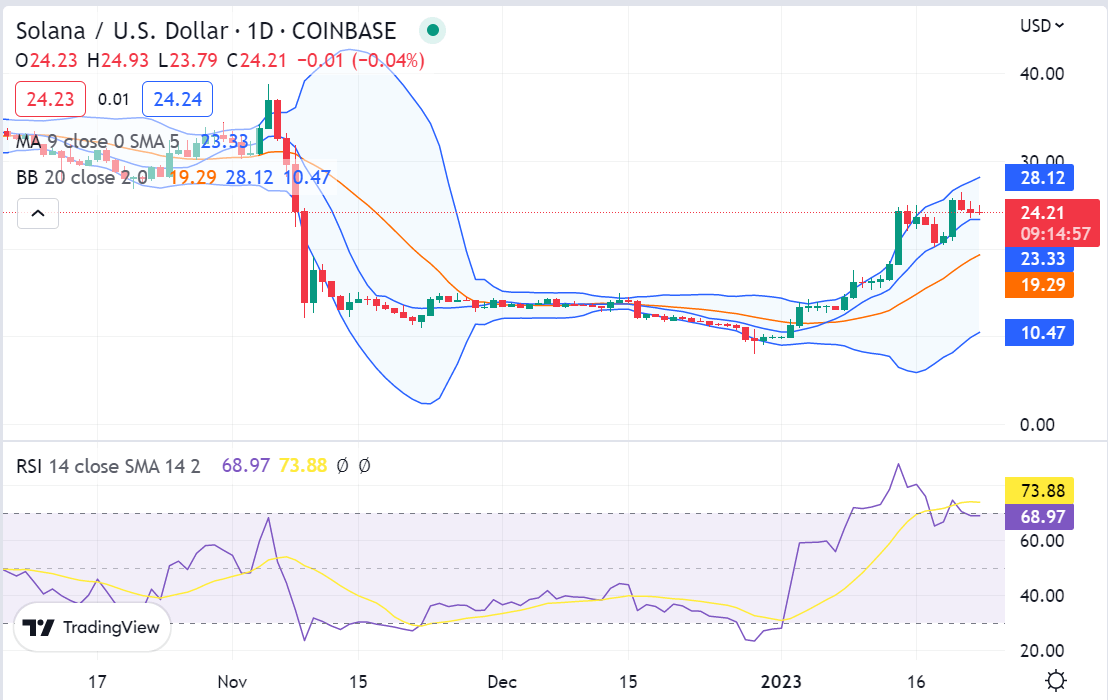
Solana price analysis 1-day price chart: SOL price follows a downward path to $24.01
The one-day Solana price analysis is depicting a downtrend for the day, as the bears have been in the lead for the past few days. The trends took an unexpected shift, resulting in a bearish win. The SOL value is currently $24.01, down by 4.09% from the open price of $25.14 and it is expected that it might go down even further during the upcoming hours.

The moving average (MA) value is at the $23.33 mark, indicating a strong bearish momentum in the market. The increase in volatility is indicating that the bearish trend might intensify in the future. The upper Bollinger band is currently at $23.38 and the lower Bollinger band is at $23.76, implying that more volatility can be expected in the near future. The Relative Strength Index (RSI) is currently showing bearish signs and the value stands at 73.88, confirming the bearish momentum in the market.
Solana price analysis conclusion
To sum up, the Solana price analysis market has been in a bearish state for the past few days, and it looks like this trend may continue for some time. The strong support of $23.76 is currently limiting any further decline. However, traders should be cautious as the bearish pressure might increase in the near future. Investors should also be aware of the fact that the current market conditions may change at any time, and they should make sure to adjust their trading strategies accordingly.


