The Solana price analysis shows a bullish outlook for the digital asset today. Bullish momentum is quite steady today as the price has been continuously rising during today’s trading session. This has been fueled by massive buying pressure, as the price gained over 10 percent in the past 24 hours.
SOL/USD opened the trading day at $20.45 and rose to a high of $22.54 due to the buying pressure. The upward momentum has been quite strong and it seems that the bulls have taken control of the market. Furthermore, at present, the price is trading close to $22.40, and holding its position above this level could be crucial for further gains in SOL/USD.
The market capitalization is currently at $8.3 billion and has gained over 10% in the past 24 hours. On the other hand, the 24-hour trading volume has seen a significant increase as well and is currently at $829 million, gaining 70.95% in the past 24 hours.
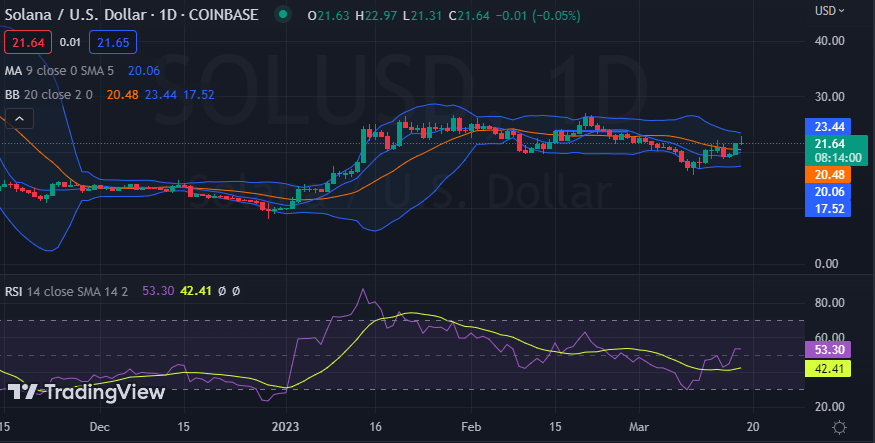
SOL/USD 1-day price chart: Bullish trend uplifts coin value up to $22.40 high
The one-day Solana price analysis is confirming an upturn in price as the bulls have been able to find their way to recovery. The ADA/USD value has been revived once again as the coin is trading at the current price level of $22.40. The price has been in an uptrend since the start of the week, and it looks like the trend might continue as well. The moving average indicator (MA) is showing its value at $20.06, with 50 MA and 200 MA both pointing in the same direction.

The price is likely to remain volatile for some time now as we are seeing strong buying pressure in the market. The Bollinger bands are also expanding, signaling high market volatility. The upper Bollinger band is at $23.48 and the lower Bollinger band stands at $17.52, which may act as support for the price if it drops further. Moreover, the Relative Strength Index (RSI) is moving in the bullish territory and is currently standing at 53.30. This means that there’s room for further gains as the buying pressure is still strong.
Solana price analysis: Recent developments and further technical indications
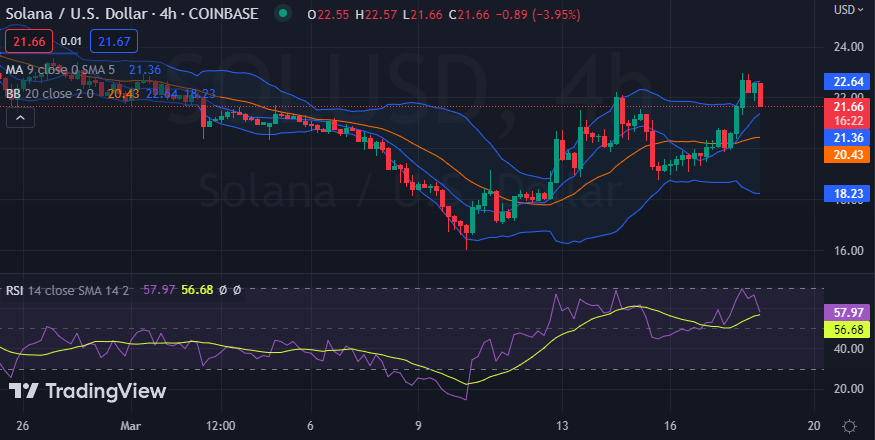
The four hours Solana price analysis confirms that a bullish trend has been following for the last 24 hours. The trending line is moving ascendingly as the price has constantly been rising for the past few hours. The price has been able to overcome the resistance present at $22.54 as well and is currently settling at $2.40. Moving on, the moving average value in the four hours price chart stands at $21.36.

A crossover between the SMA 20 and SMA 50 has also been recorded, indicating a possible bullish signal. The Bollinger bands are also expanding, suggesting high volatility. The upper band is currently standing at $22.64 and the lower band stands at $18.23. Additionally, the Relative Strength Index (RSI) is trading in a neutral zone with a value of 57.97.
Solana price analysis conclusion
Overall, the Solana price analysis shows that the bulls are in full control of market sentiment and could potentially push the price even higher in the coming days. The technical analysis is also confirming a bullish trend for the digital asset, as support levels and indicators are all pointing in the same direction. The next target that buyers are likely to target is the $23.40 resistance level, beyond which we could see even higher prices being reached.


