Solana price analysis shows a bearish trend for today. The bears have taken over the price charts once again and have brought down the price from $12.74 to the $12.78 level; as the broader market is bearish, Selling pressure came in during the last hours of the previous trading session, which turned the entire trend bearish yesterday and is on the go till now. Though the price has been in the upper price channel as recently, on 17th November, SOL observed a new record high, but the coin is under a strong correction, and the loss is significant, further degradation of price is also expected in the hours.
SOL/USD 1-day price chart: Bulls stand helpless as bears dominate
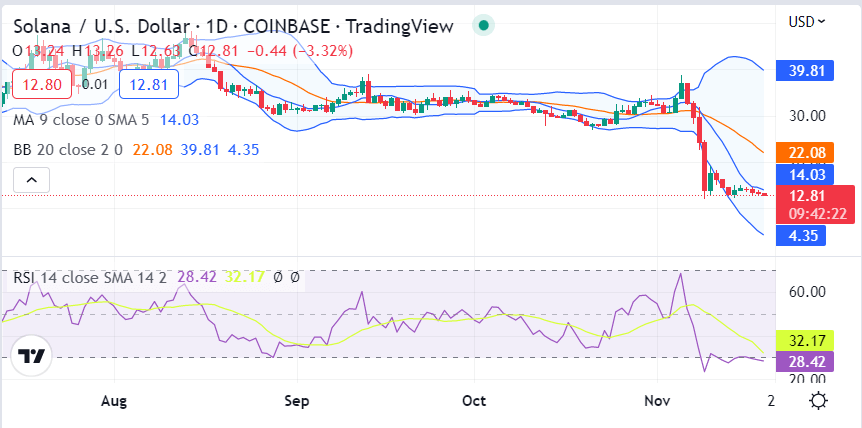
The 1-day price chart for Solana price analysis shows the price levels have sunk tremendously today as the price breakout was downwards today, and the price continues to go down. The SOL/USD pair is trading hands at 12.78 at the time of writing, losing another 5.93 percent today. As the coin is one downfall, the crypto pair is also showing a loss of 15.86 percent over the past week, as for the last seven days, bears ruled the market, and a bullish lead was observed for only one day. The trading volume is at $344 million over the past 24 hours, and the market capitalization stands at $4.628 billion.

The volatility is increasing for SOL/USD as the Bollinger bands are diverging again, with the upper end of the indicator at the $13.66 mark while the lower end of the Bollinger bands is present at the $12.73 mark. The relative strength index (RSI) is moving downwards at a sharp curve and has reached an index of 32.17 in the lower half of the neutral zone. The RSI level is still acceptable, but it may sink further in the coming hours if the heavy sell-off continues.
Solana price analysis: Recent developments and further technical indications
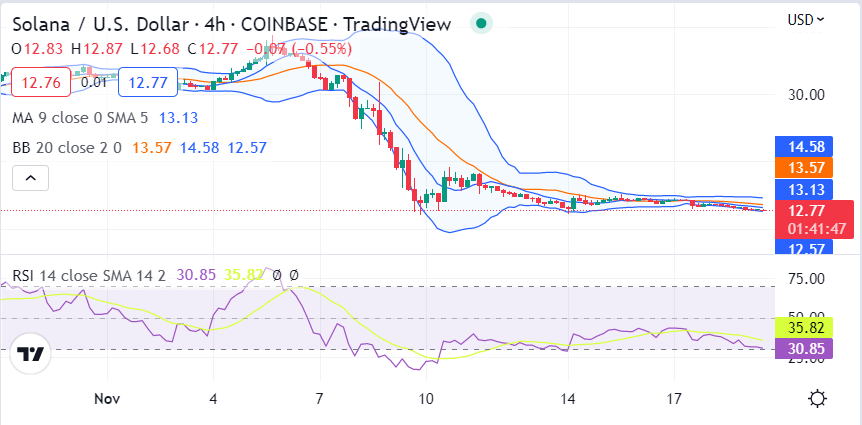
The 4-hour price chart for S price analysis shows a continuous degradation of price, and no considerable bullish effort has been observed today, despite the fact that bulls intervened in between and tried to elevate the price levels for a few hours, but they were soon outplayed by bears. The price is going down again and has been seen decreasing in the last four hours as well.

The relative strength index (RSI) has entered the undersold zone recently, and its curve is downwards as of now as it is showing a score of 35.82. The RSI curve indicates the high selling activity in the market and the great bearish pressure that has engulfed the price action.
The moving average (MA) continues to trade below the SMA 50 at $13.11, and the price is trading below the lower limit of the Bollinger Bands on the 4-hour chart, which at $12.57. The overall volatility indicator is continuing its downward slope, hinting at the price traveling low for the coming hours.
Solana price analysis conclusion
To sum up, the Solana price analysis shows that the bears are in full control of the market, and they have brought down prices significantly today. Crypto is under strong bearish pressure, and further degradation of price levels can be expected in the hours to come.


