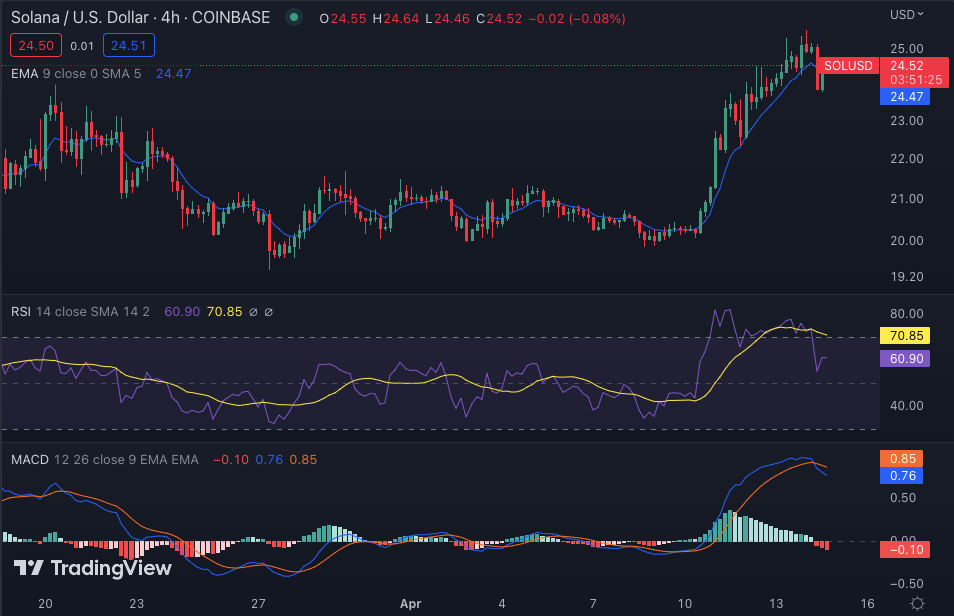
The Solana price analysis suggests the SOL/USD price function has been suppressed by the bearish pressure, as a drop in price level has been reported for today. The bulls are trying to hold on to $25.46 after following the downward movement since today afternoon. Right now, SOL is trading around $24.34, with a decrease of 1.67 percent in the last 24 hours.
The support for SOLUSD is present at $23.82, and a break of this level could push the price toward its next support level at $22.39. The bulls need to regain momentum above $25.46 if they want to take back control of the market. A bearish divergence has been recorded in the Solana price analysis, which could put the bulls in a vulnerable position.
Solana price analysis daily chart: Bearish momentum drags price to $24.34
The daily chart for Avalanche price analysis is showing signs of bearish activity as the red candlestick has returned to the price chart. The past few days have proved crucial for cryptocurrency, as an upward trend has been following. There has been a recurring rise occurring in the coin value, however, today the price failed to break beyond its resistance level of $25.46.

The bearish divergence present in the chart can be seen as a sign of bearish momentum, dragging down the price to $24.34. The MACD and EMA indicators have also turned red in line with this trend, indicating that bears are taking control of the market. The 19 EMA is moving in a downward direction, signaling that supply is higher than in the market. The RSI value is at a low position of 68.36 and it needs to break above the 70 levels if bulls want to take back control of the trend.
Solana price analysis hourly chart: Recent updates
The price has been traveling low according to the four hours Solana price analysis. The recent downturn in price movement has resulted in its decline as it has been lowered below $25.00. Chances of recovery seem bleak at this point, as the selling pressure has been quite high.

The hourly MACD indicator is in the red zone after crossing over to a bearish trend, Additional the moving average convergence divergence (MACD line is below the signal line, indicates more bearishness in prices. The hourly RSI is also trading at a low level of 60.90, suggesting that bears have an upper hand in the market. The 20-EMA is below the 50-EMA, which is a strong bearish signal.
Solana price analysis conclusion
Overall, the Solana price analysis suggests that the short-term outlook for SOL/USD pair appears to be bearish and it needs to break past $25.46 in order for bullish momentum to gain strength. The technical indicator levels are also indicating more negative price action, hence investors should be cautious while trading in the coin. However, if the bulls can take back control of the market above $25.46, then SOL/USD could once again rise toward its next resistance level at $28.58.


