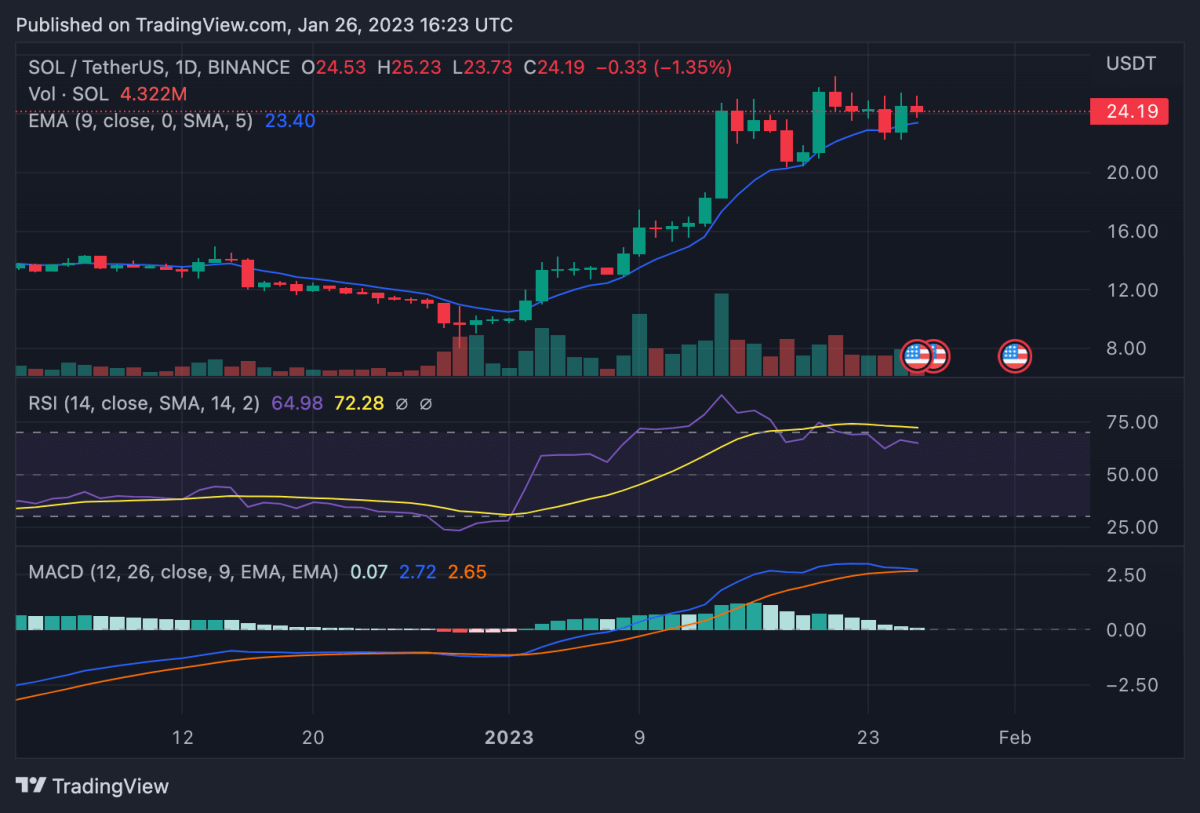
Solana price analysis shows strong signs of a continued upward run as price rose more than 3 percent over the past 24 hours to move as high as $25.21. Since the start of January, Solana price has increased from $9.37 to a high of $26.54 on January 21, incurring a 183 percent rise. However, the past week has seen increased volatility in the market with a fair bit of seller domination observed. The next target for bulls will be the resistance point at the $27 mark. Failure to form a breakout past this point could also result in bears taking control with price dipping down to $20.
The larger cryptocurrency market also continued to show strong signs over the past 24 hours, as Bitcoin rose up to $23,000, and Ethereum moved up to $1,600 with a 3 percent incline. Among leading Altcoins, Ripple rose up to $0.40 with a minor uptrend, whereas Cardano jumped 6 percent to move as high as $0.37 and Dogecoin to $0.08 with a 2 percent increment. Meanwhile, Polkadot also rose 3 percent to rise up to $6.39.

Solana price analysis: 24-hour RSI falls below bullish threshold to indicate price correction
On the 24-hour candlestick chart for Solana price analysis, price price can be seen dwindling around the $21-$25 mark over the past 24 hours, showing increased volatility in the market. However, bulls have largely remained in control in keeping price above support at $20, and the crucial exponential moving average (EMA) at $23.31. As price targets resistance at $27, technical indicators suggest a correction may be in order before that.

The 24-hour relative strength index (RSI) can be seen dropping off the overbought region after initially hitting highs at 80. This usually suggests an upcoming correction for price. Trading volume over the past 24 hours dropped slightly, indicating little buyer movement at current price. Moreover, the moving average convergence divergence (MACD) curve can also be seen attempting a bearish divergence with the formation of lower highs.
Disclaimer. The information provided is not trading advice. Cryptopolitan.com holds no liability for any investments made based on the information provided on this page. We strongly recommend independent research and/or consultation with a qualified professional before making any investment decisions.


