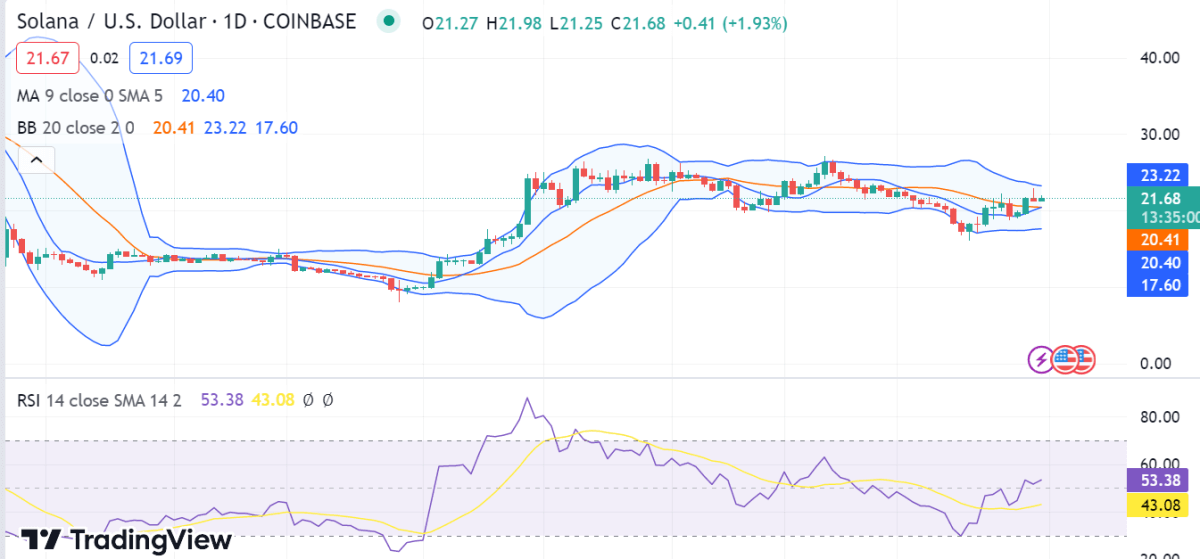
The recent Solana price analysis shows a downward trend as the market falls below $21.67. The SOL coin has been trading below the $ 21.14 level since the beginning of today, and the downward trend has continued to dominate the market for the past 24 hours. The coin has been struggling to stay above the $21.14 level, with the price dipping even lower in the days that followed. Resistance is seen at the $22.54 level, while further support can be found at the $21.14 mark. If the coin manages to break out of this level, it could be set for a short-term rally. The 24-hour trading volume has also declined and is currently at $518 million, while the market capitalization for SOL/USD pair is trading at $8.3 billion.
SOL/USD 1-day price chart: Price drops to $21.67 lows as strong bearish momentum develops
Looking at the daily Solana price chart reveals that the digital currency has been trading within a descending channel since the beginning of today. The bulls are currently struggling to keep the price above the $22.54 level, and if they fail to do so, a further decline could be seen in the days ahead. The nearest level of support can be found at the $21.14 mark, which, if broken, could pave the way for the near future.

The 50-day moving average is seen at $21.68, and the 200-day moving average is sitting at $20.4. The market volatility for the SOL/USD pair is low, as the price is trading in a tight range below $21.67. The upper Bollinger band value is now $23.22, whereas the lower Bollinger band value is $17.60. The relative strength index (RSI) is seen at 43.08, indicating that the coin has some room to go before it reaches the oversold region.
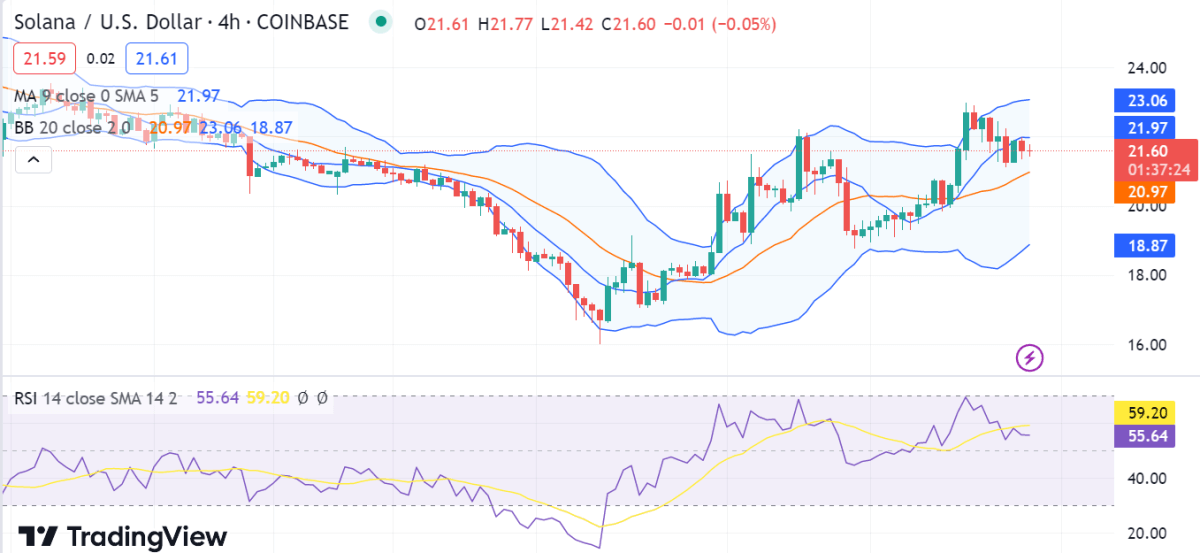
Solana price analysis 4-hour chart: Latest development
The 4-hour Solana price analysis indicates that the coin is trading in a bearish trend. The digital asset has been unable to break out of the $21.14 level, and if it fails to do so, a further decline could be seen in the days ahead. The bears have successfully managed to keep the price below the $21.14 level, and a break out of this could result in a short-term rally.

The relative strength index (RS) is currently hovering around 59.20, which shows that the bears are in control of the market. Moreover, the moving average (MA) indicators are showing mixed signals, with the 50 MA sitting above the 200 MA. The Bollinger Bands indicator average has decreased to $20.97, whereas the upper Bollinger band is showing a $23.06 reading and the lower band is showing a $18.87 reading, representing a high volatility range for the SOL.
Solana price analysis conclusion
Overall, the Solana price analysis shows that the digital currency is trading in a bearish trend and is likely to break out of its current range. The technical indications are primarily bearish, and the market may experience some selling pressure in the near term. Currently, in a phase of consolidation, the market may find direction if it breaks out above either $21.14 or $22.54.The coin needs to move above the $ 22.54 level in order to see a short-term rally; if it fails to do so, a further decline could be seen in the days ahead.


