Solana price analysis shows that the coin has been facing a bearish trend in the market for the last 24 hours. The coin has been trading under a descending triangle pattern and is currently testing the $32.2 level. Support for SOL/USD is present at $31.95, and If this support level breaks, then Solana’s price may decline to $331.50. Resistance for SOL/USD pair is present at $32.86. A break above this level may push the price to $33.00.
The bears have been in control of the Solana markets after encountering bullish pressure around $32.2. Since then, the price has been on a downward spiral and is currently trading below the $32 level. The 24-hour volume is reported to be $551 million, and the market cap is $11 billion.
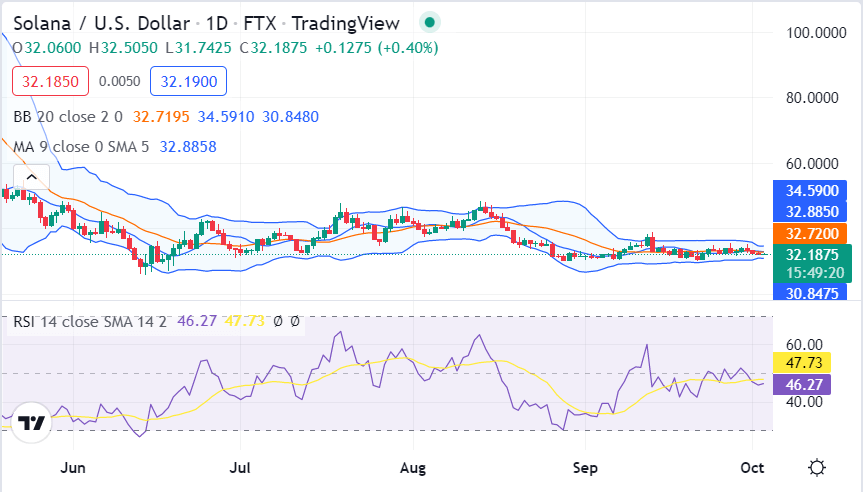
SOL/USD 1-day price chart: Solana price is facing resistance at $32.86
The Daily Solana price analysis is showing a bearish trend for today as the price has depreciated today as well. The bearish momentum has been continuing over the past few days, and today, the trend is the same. The price has been lowered to the $32.2 level after the latest drop. The crypto pair has been at a loss of 1.66 percent for the last few hours. The moving average indicator (MA) is present at the $32.88 mark above the price level.

The upper Bollinger band value is $32.86, representing resistance, whereas the lower Bollinger band value is $31.95, representing support for the cryptocurrency price. The Bollinger bands are maintaining an average of $32.71, just below the current price level. The Relative Strength Index (RSI) is present at index 47.73 in the neutral region, indicating unfavorable circumstances for SOL, as the downwards curve of the indicator shows the selling activity in the market, which is depreciating its value.
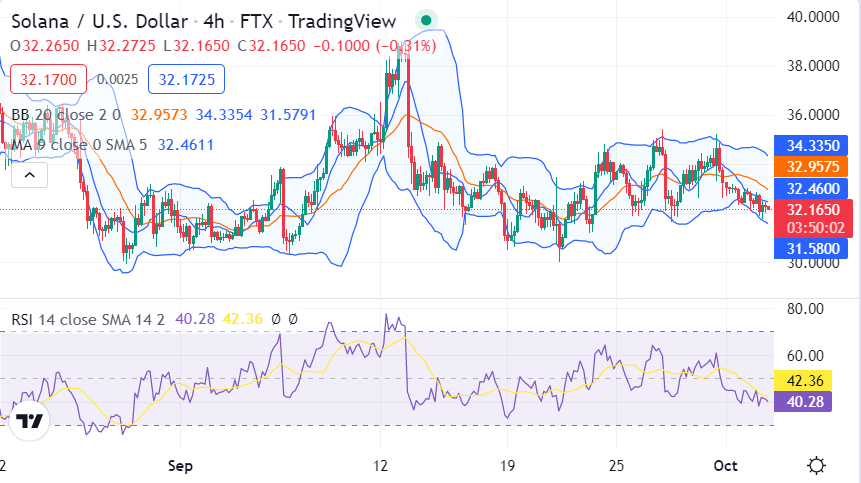
Solana price analysis on a 4-hour price chart: SOL prices decline to $32.2
The 4-hour Solana price analysis shows that the market looks bearish as prices have declined from highs near $32.The price is going down once again as a bearish trend has been observed to strengthen during the last four hours. A steady decline in price levels can be seen on the charts as the price has been following a bearish movement for the last 24 hours. The market has faced a strong sell-off, and the prices have not been able to find any buyers at higher levels. The market is currently in a consolidation phase, trading between $ 31.95 and $32.86.

The current price is still below the moving average, whose value is present at the $32.46 mark on the 4-hour chart. The Bollinger bands indicator average has decreased to $32.16, whereas the upper Bollinger band is showing a $32.46 reading, and the lower band is showing a $31.58 reading, representing high volatility range for SOL. The RSI curve is headed downwards at index 42.36, as the bearish pressure seems immense.
Solana price analysis conclusion
In conclusion, Solana price analysis shows that the coin has been facing a bearish trend for the past two days. The market may see some selling pressure in the near future as the technical indicators are mostly bearish. The market is currently in a consolidation phase, and a breakout of either $32.86 or $31.95 could give some direction to the market.


