Solana price analysis is currently bearish as the market slides below $31.36. This comes after a period of consolidation around this price level. The bears now seem to be in control as they push SOL/USD prices toward support at $31.20.The Solana market has been in a consolidation phase over the last few days as it trades between $31.00 and $32.60.
The Altcoin has lost almost 3.42% in the past 24 hours and is currently trading at $31.36. The market capitalization sits at $11.2 billion with a 24-hour volume of $624 million.
SOL/USD 1-day price chart: Price suffers as bears strike back
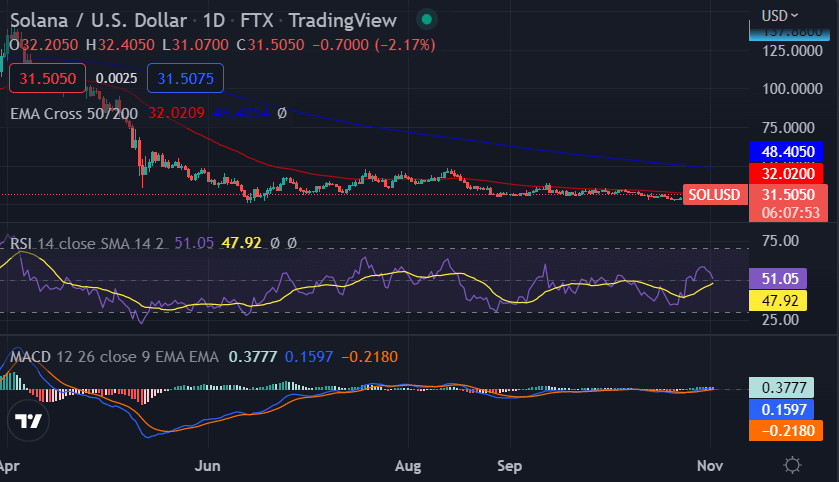
The daily price chart for Solana price analysis confirms a strong bearish trend for the market today as the price covered a downward movement in the past 24 hours. The market is currently trading very close to the key support level at $31.20 and any further movement to the downside could see the price retesting the lows of the $31.00 support level as a bearish attempt to defend this level. The current market conditions for SOL/USD seem to be bearish in the short term but a breakout from the current consolidation range could see the market make a move toward $32.55.

The exponential moving averages also show a bearish trend as the 50 EMA crosses below the 200 EMA indicating that the bears could be in control of the market in the short term. However, we should also keep an eye on any bullish movements as RSI levels remain below 50 showing that there is still some buying pressure in the market. The MACD histogram also shows a bearish trend as it falls below the 0 lines.
SOL/USD price chart: Price action is expected to remain bearish
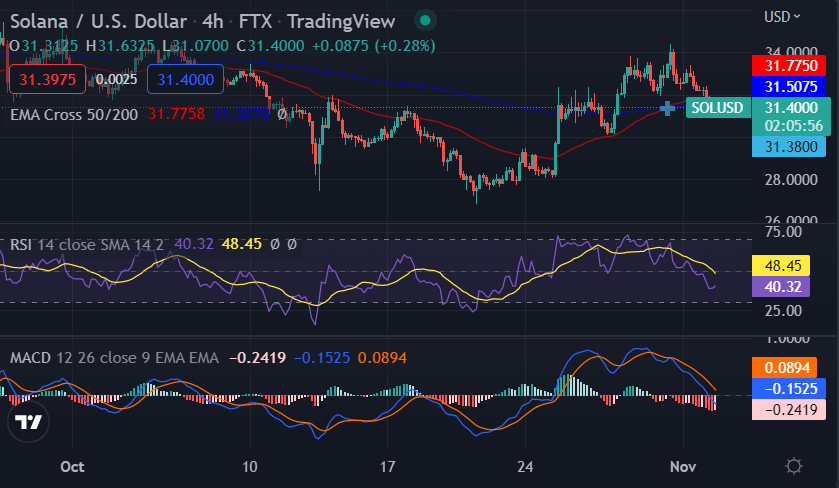
The 4-hour price chart for Solana price analysis shows that the market has been in a bearish trend since the beginning of today. The market had attempted to make a move toward $32 but was unable to sustain this level and fell back to $31.36.

The Moving Average Convergence Divergence (MACD) line is currently below the signal line indicating a strong bearish trend in the market. The Relative Strength Index (RSI) on hourly charts also shows that the market is currently oversold as it is currently at 48.45. The EMA on hourly charts also shows a bearish trend as the 50 EMA crosses below the 200 EMA.
Solana price analysis conclusion
Overall, Solana price analysis shows that the market is expected to remain bearish in the short term as it trades near support levels. Traders should keep an eye on key levels for potential entry and exit points. But, any bullish movements could see the market make a move toward resistance at $32.55.
Disclaimer. The information provided is not trading advice. Cryptopolitan.com holds no liability for any investments made based on the information provided on this page. We strongly recommend independent research and/or consultation with a qualified professional before making any investment decisions.


