According to the most recent Sui price analysis, the market has displayed a bullish trend with signs of recovery over the past 24 hours. Despite a gradual price oscillation, the bulls have successfully gained dominance on the price chart by elevating the coin’s value. This positive development indicates a promising outlook for the bulls, as the price has once again reached the $1.010 mark. Although there is potential for further recovery, it is anticipated that the bullish momentum will continue to be slow, and the coin is still regarded as undervalued.
SUI/USD 1-day price chart: The price experiences positive sentiment, recovering to $1.010
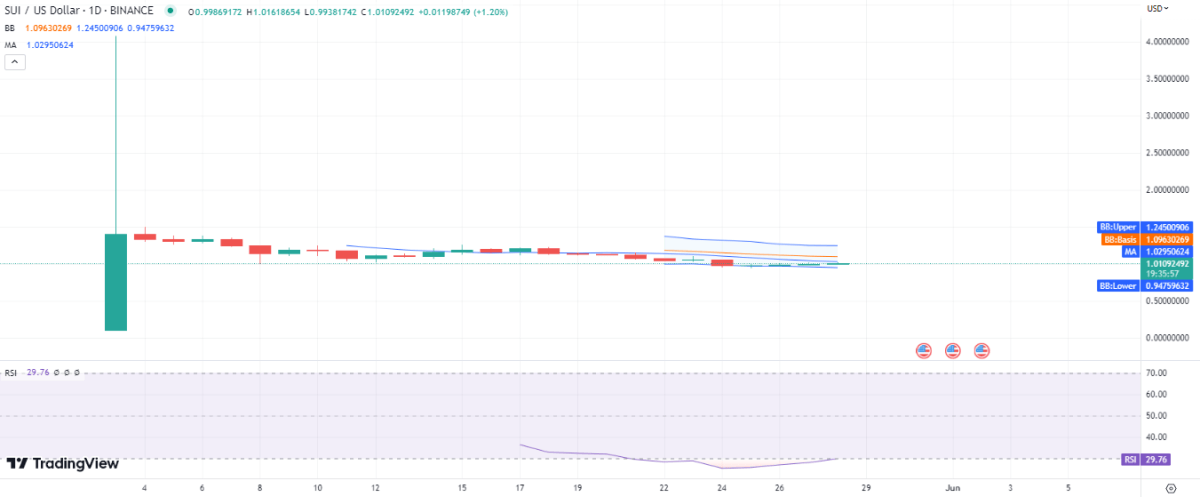
Based on the latest daily Sui price analysis, a bullish momentum is evident as buying activity has outweighed selling in the past 24 hours. The last instance of bearish activity on the 1-day chart occurred on May 24, 2023, and since then, a gradual bullish trend has been established. However, the price has only managed to recover to $1.010, which remains below the point where the previous correction began. Over the past 24 hours, the coin has gained 1.10 percent, but it has experienced a significant loss of 10.28 percent over the course of the week. Nevertheless, considering the bigger picture, the price has maintained its stability following the last correction, with the coin currently trading at $1.010. It’s worth noting that the price still sits below its moving average (MA) value, which is at the $1.029 level.

The market volatility remains relatively subdued, with the upper edge of the Bollinger Bands indicator positioned at $1.245, indicating a resistance level, and the lower edge resting at $0.947, representing a robust support level. Meanwhile, the Bollinger Bands indicator displays an average value of $1.096. As for the Relative Strength Index (RSI), it shows an upward trajectory at a reading of 29, suggesting increasing buying activity as it gradually approaches the border of the neutral range.
Sui price analysis: Recent developments and further technical indications
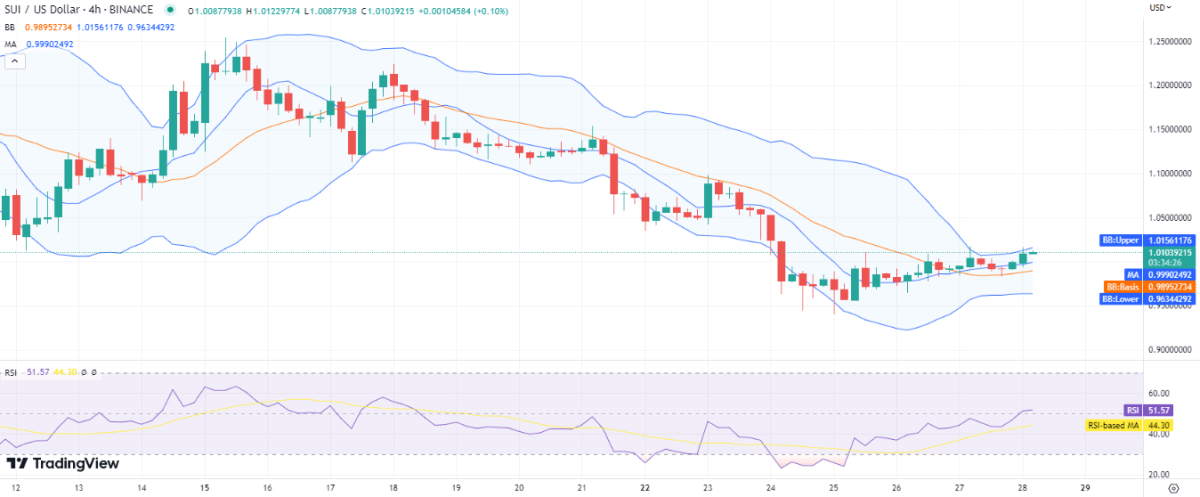
Based on the four-hour Sui price analysis, there is a clear upward trend as the price has experienced an upward movement over the past eight hours, accompanied by an upward breakout. This can be observed on the four-hour price chart, where green candlesticks indicate a rise in the coin’s value. The bullish momentum has effectively propelled the price above the $1.009 threshold, suggesting that the bulls are likely to drive the price even higher. Furthermore, the moving average on the four-hour price chart is situated at the $0.999 level.

The market volatility is currently low, as evidenced by the narrowing of the Bollinger Bands, indicating reduced price fluctuations. The upper value of the Bollinger Bands indicator stands at $1.015, while the lower value is at $0.963. Additionally, the Relative Strength Index (RSI) score has risen to a reading of 51, reflecting the presence of buying momentum in the market.
Sui price analysis conclusion
The one-day and four-hour Sui price analysis indicates an upward trend for the cryptocurrency as buying activity gains momentum. The bulls have continued to lead the market by increasing the coin value, resulting in a lower high of $1.010. Additionally, the hourly price chart shows a series of green candlesticks, signifying a recent increase in the market value of the cryptocurrency.


