Tezos price analysis is bullish for today, as an increase in price up to $1.40 has been observed. The bulls have been successful in crafting a slight upwards trend line for the price function during the last 24-hours, and the trend is the same at the time of writing as well. Although the price touched the $1.41 height earlier today, due to the strong resistance present at this level, the price function reverted back, and the XTZ/USD price has fallen to the $1.36 support level.
The trading volume has also increased over the last 24 hours, as it is currently sitting at $20,832,731, which indicates that the bulls are gaining strength. The market cap for the coin is also climbing and is currently sitting at $20,832,731.
Tezos price analysis on a 1-day price chart: Bulls successful in crafting a short-term upwards trend
The 1-day chart for Tezos price analysis indicates a bullish trend for the market today, which has been quite unexpected. The price levels have upgraded abruptly, which has provided a push to the bullish price movement. Nonetheless, the increase in price has been surprising as bears were expected to grow in the first place. XTZ/USD pair shows an increase in value by 1.41 percent over the last 24 hours as the overall trend has been slightly upwards.

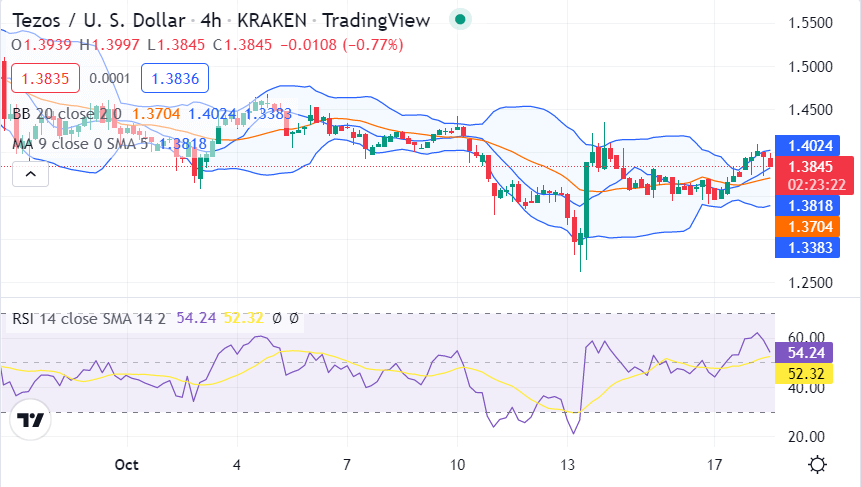
The upper limit of the Bollinger bands is present at the $1.41 mark representing resistance for XTZ to overcome if the bullish momentum continues, while the lower band is present at the $1.36 level representing support for XTZ, and the mean average of the indicator is present at the $1.38mark below the price level. The 24-hour moving average (MA) is currently at, which is present at the 1.38 mark, and the RSI indicator is currently at 52.32 and is rising, which indicates that the market momentum is gaining strength.
Tezos price analysis: Bulls continue to dominate as XTZ/USD nears $1.40
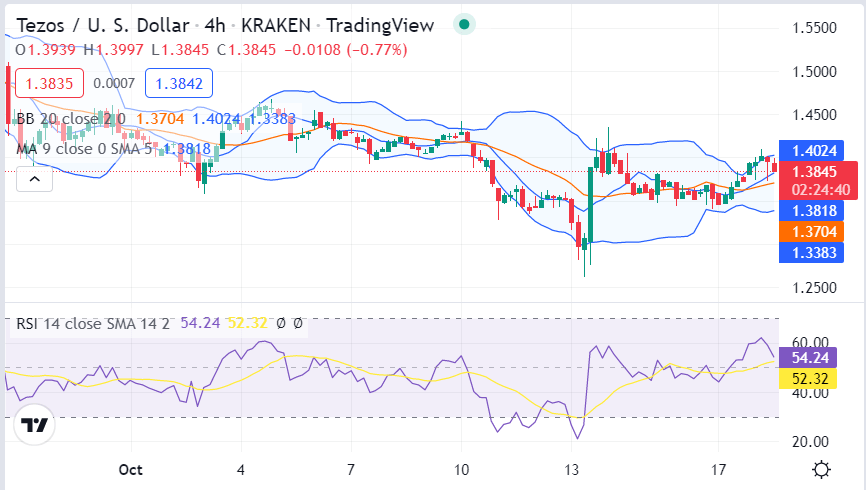
The 4-hour Tezos price analysis shows that the price breakout was upwards at the start of today’s session following the bullish lead. Overall the trend remained upwards for the last 4-hours continuously until the coin met strong resistance at $1.41.

The volatility has been increasing on the 4-hour chart as the Bollinger bands are expanding, the upper band is present at the $1.40 mark, and the lower band is present at $1.37 for XTZ. The MA is present at the $1.38 mark, and the RSI indicator is currently at 52.52 and is slowly rising, which indicates that the bullish momentum may increase.
Tezos price analysis conclusion
Tezos price analysis concludes that XTZ prices are currently trading in a bullish manner and are likely to move higher in the near term as the bulls remain in control of the market. Both the hourly and the daily technical indicator are currently in a bullish state, and they are indicating that the bulls have the upper hand in the market.


