The latest Uniswap price analysis confirms a downward trend for the market as the cryptocurrency faced bearish resistance during the past two days. Although the situation favored the buyers in the previous week, the bears managed to escape the bullish wave in the past two days. Currently, the coin value sits at the $5.60 position, and it might drop even further if the selling pressure resumes to increase.
UNI/USD 1-day price chart: Bearish takeover results in a price drop up to $5.60
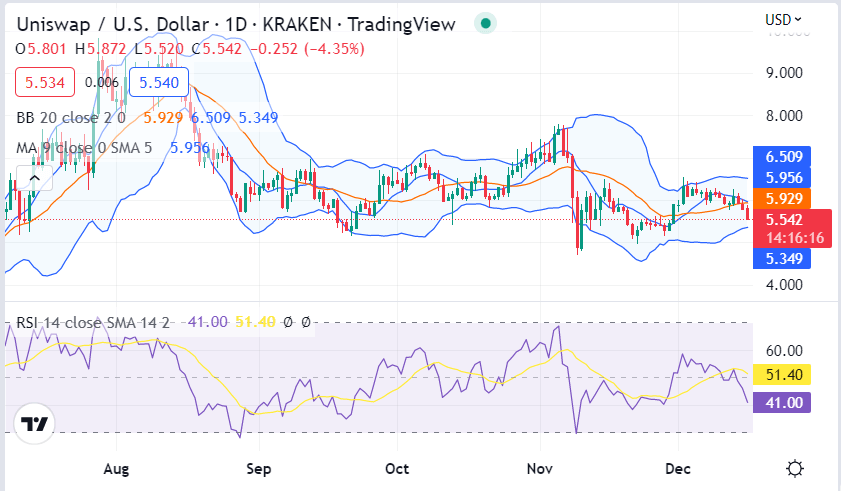
The daily Uniswap price analysis gives the bears the leading position as more selling activity has been taking place for the past few days. Although a strong bullish wave dominated the market in the preceding week, today’s trend proved relatively in support of the sellers. The market value of UNI/USD has dropped up to $5.50 because of the downward trend. The price is now lower than its moving average (MA) value, i.e., $5.95.

The volatility is on the increasing side because the Bollinger bands are expanding, and this is a rather bearish indication regarding the upcoming market trends. The upper value of the Bollinger bands indicator now sits at $6.50, whereas its lower value stands at $5.34. The Relative Strength Index (RSI) score has decreased to 51.40 because of the latest downturn in price.
Uniswap price analysis: Downslide devalues UNI/USD to $5.60 extreme
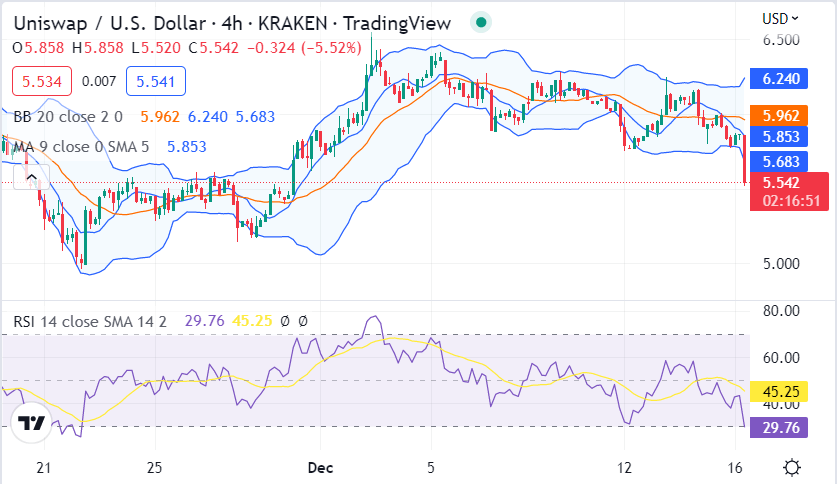
The four-hour Uniswap price analysis confirms a strong bearish trend as the coin value has dropped exceedingly in the past few hours. The bears have been overruling the bulls for the past few hours by securing consecutive wins. Currently, the selling activity intensifies further as the coin value has been lowered to $5.60 extreme. Chances of further devaluation in cryptocurrency value seem quite near. Moreover, the moving average value in the hourly price chart is at $5.85 point.

The volatility is increasing, which means that the ongoing downtrend might also extend in the upcoming hours if the sellers remain consistent. At the same time, the upper Bollinger band is now resting at $6.24 high, while the lower Bollinger band is present at $5.64. The RSI graph shows a downward curve, as well as the score, has moved down to 45.25.
Uniswap analysis conclusion
To conclude, the Uniswap price analysis is giving the lead to the sellers as a downtrend has been observed in the past 24 hours. The coin value has receded to $5.60 because of the latest drop in price. The hourly price chart displays a series of red candlesticks, which are indicative of a strong bearish wave.


