Uniswap price analysis indicates its current price action is indicative of a bearish trend that is slowly but surely building up. After breaking down from the ascending triangle pattern in mid-week, UNI has been consistently trading below the $5.62 mark after the massive rejection. The current price action suggests that the bears are looking to take control of the market as it continues to battle with resistance at $5.62.
The current support level for UNI stands at $5.26, which is where the bears are currently at. A move below this level could see UNI falling back to its previous support levels at $5.10 and $5.00. If the bears are able to push past this level, then UNI could be headed for a major breakdown.
UNI/USD 4-hour price analysis: Latest developments and technical analysis
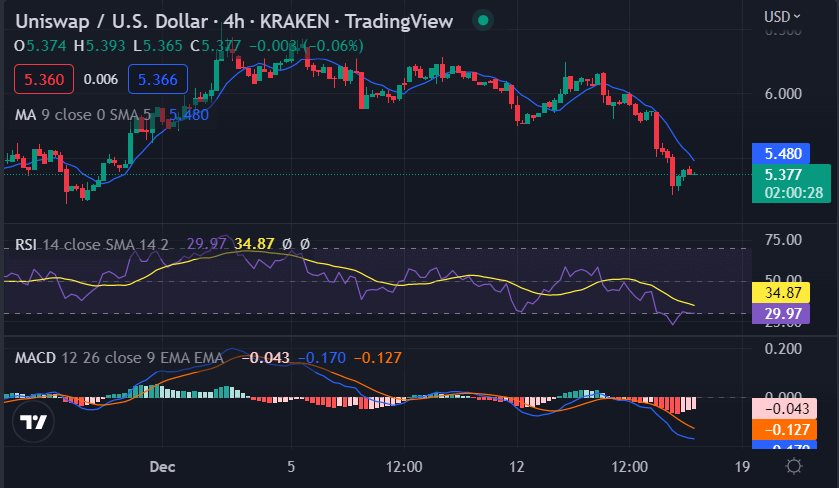
The Uniswap price analysis on a 4-hour chart shows UNI has been following a descending triangle pattern. The descending triangle is a bearish continuation pattern that is formed when the price action of an asset creates lower highs and finds support around a horizontal level.

The Relative Strength Index (RSI) is currently at the 34.87 level and is slowly heading towards the oversold region, which is a further indication that the bears are in control of UNI price action. The Moving Average Convergence Divergence (MACD) indicator is also in the negative territory and shows that the bearish momentum is still in play. The moving average on the 4-hour chart is also below the current price action, which further confirms the bearish sentiment in the market.
Uniswap price analysis on a daily chart: Bears adamant in pushing UNI below $5.37
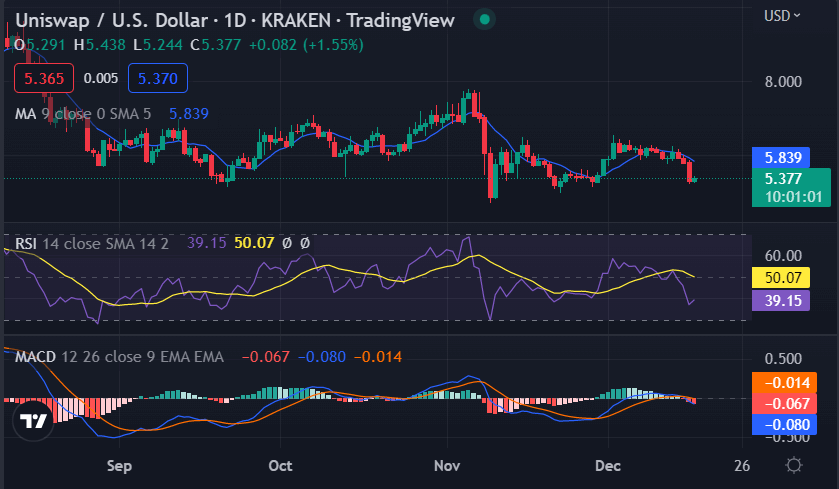
The Uniswap price analysis on the daily chart shows the prices have been hovering around a range of $5.26 to $5.62 for the last 24 hours. The bearish trend is likely to continue as long as UNI remains below the $5.62 mark. The bears are currently trying to push UNI below the $5.26 support level, and if they succeed, then UNI could be headed for further declines. The altcoin has decreased by almost 3.32% over the past 24 hours, with its current price at the $5.37 mark.

The bearish trend is further evident on the daily chart as the moving average,(MA) is below the current price action. The MACD indicator is also in the negative zone and has created a bearish crossover. The RSI is currently at 50.07, which is in the oversold region, indicating that there is still a lot of bearish pressure in the market.
Uniswap price analysis conclusion
Overall, Uniswap’s price analysis suggests that the bears are in control of the market and UNI is likely to continue its bearish trajectory. The bulls will need to gather enough momentum and push past the $5.62 resistance level if they want to turn the tide in their favor.


