Uniswap price analysis is indicating a drop in price today, as the price has lowered to $5.29 after the continuation of the bearish trend since yesterday. The past few hours have been crucial for the cryptocurrency, as bulls have also tried to prevent price slippage but bears are yet in dominating position. The bears have taken the price down to the level of $5.29, and a further decline in the UNI value can be expected as well. The bears have pinned down the outgrowing bullish momentum, in their struggle to maintain the lead.
UNI/USD 1-day price chart: Sellers are persistent in maintaining the bearish pattern
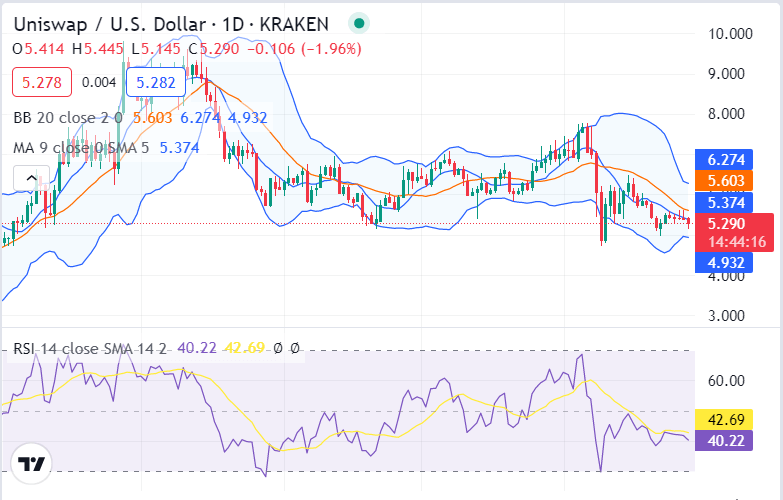
The 1-day Uniswap analysis is showing a small decrease in the price today, as bulls and bears are clashing with one another for lead. The price has been slightly downgraded to an extent and it is now resting at $5.29 in the 1-day price chart reporting a loss of nearly 4.21 percent for the last 24 hours. The past few days have been highly supportive for the buyers, which resulted in a continuous bullish trend for UNI but today, the bears took over and pushed down the price to their desired support. The moving average (MA) is still standing below the current price,$5.28, and it is indicating a bearish continuation from the current point.

Moreover, the volatility is comparatively low, and the upper Bollinger band is present at $5.56, while its lower band is at $5.19. The Relative Strength Index (RSI) is trading on a horizontal curve with a slightly downward slope because of the recent bearish activity and is present at index 42.69 in the lower half of the neutral zone.
Uniswap price analysis: Recent developments and further technical indications
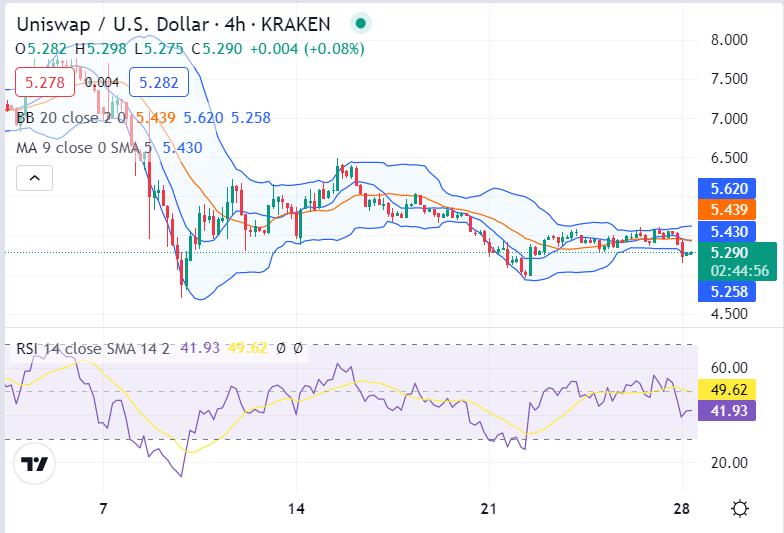
The 4-hour Uniswap price analysis is dictating that a further decline in the price is to follow after a recent bullish attempt to do otherwise. The bears have caused the price levels to fall below the $5.29 mark, thereby securing their recent lead.

This has added to the bearish momentum, however, the downfall is yet under control. Overall, the market had mixed sentiment today, for both the buyers and sellers as the most recent price movement has been in the upwards direction. As the Bollinger bands expanded, their upper value reached $5.62, while the lower value reached $5.25. Lastly, the RSI score has also increased to an index of 49.62 during the last four hours. The MA indicator is now situated above the current Uniswap price and it is showing stability in the market.
Uniswap price analysis conclusion
The 1-day and 4-hours Uniswap price analysis charts are giving a bearish signal for the day as the sellers are aiming to take the price even below the $5.29 mark. The bullish efforts might be slowing down, however, we can expect some bullish support from the current levels to prevent a further decline.
Disclaimer. The information provided is not trading advice. Cryptopolitan.com holds no liability for any investments made based on the information provided on this page. We strongly recommend independent research and/or consultation with a qualified professional before making any investment decisions.


