The latest Uniswap price analysis is giving the lead to the buyers, as the bullish momentum has gained stability in the last 24 hours. The price is on its way toward revival and has been recovered up to the $5.43 mark during the day. For the past few weeks, the overall market trends have been in bearish support, but currently, the circumstances are seemingly transforming. Further recovery is possible if the buyers remain persistent in their efforts.
The support for UNI/USD is present at $5.41, and a break below this level may result in a price decline to the $5.20 support level. On the other hand, the resistance for the pair is at $5.57, and a breakout above this level could take it to $6.00 levels, which is the next major resistance.
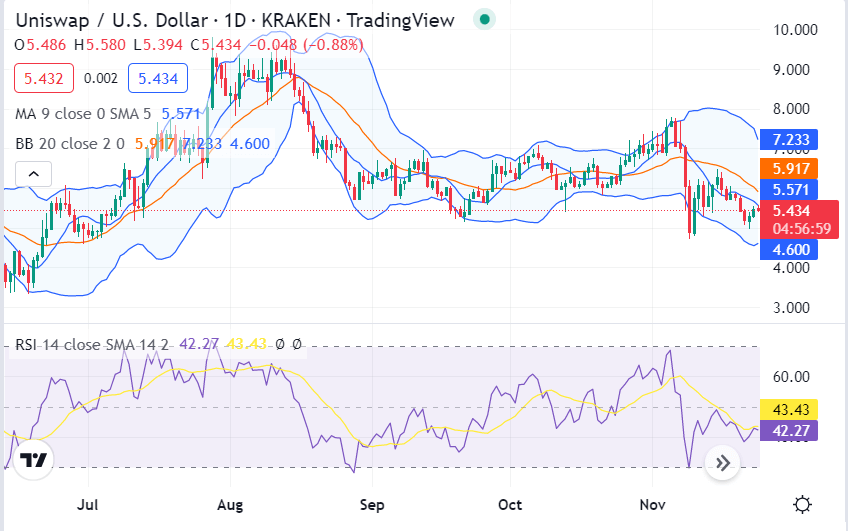
UNI/USD 1-day price chart: Cryptocurrency value finds recovery above $5.43
The 1-day Uniswap price analysis chart shows that the cryptocurrency is currently trading in an ascending channel. The digital asset has seen a strong rally over the last few days as it surged from $5.41 to its current price level. However, the market may see a correction in the near future as the RSI indicator is currently in the overbought region.

The volatility is increasing on the 4-hour chart, as the MA reveals increasing bullish momentum in the market as the price is currently at $5.57. The RSI indicator is also moving in the overbought region, which indicates that ADA/USD may see a slight correction before it can resume its upward trend. The upper Bollinger band is at $7.23, while the lower band is at $4.60.
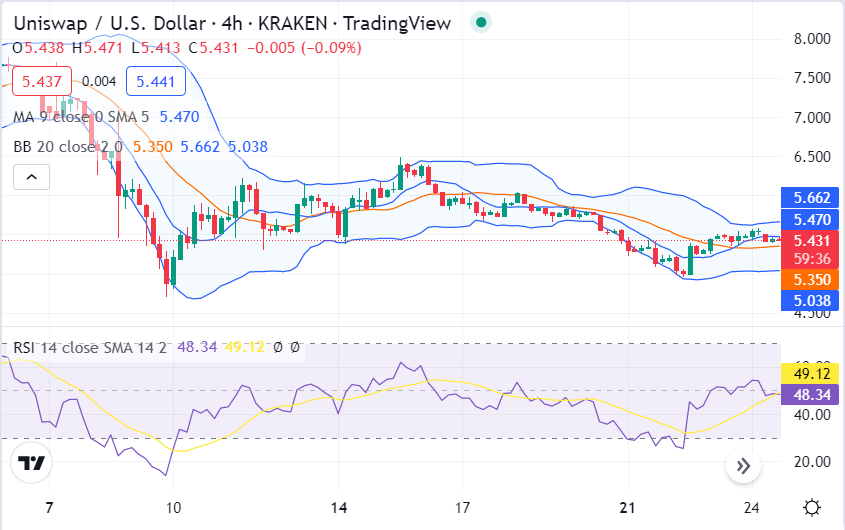
Uniswap price analysis: Bullish strike launches price above $5.43 hurdle
The hourly Uniswap price analysis chart reveals that the cryptocurrency has been following an uptrend for the last few hours. On the other hand, the price has seen a slight downtrend over the previous few days as the market corrects itself after a strong rally. The market has formed higher highs and higher lows which is a bullish sign. The moving average (MA) on a 4-hour price chart is present at $5.47 due to the bullish trend.

The Bollinger bands are diverging, which means that the volatility is increasing, and the price might experience a fall in the next few days. The upper Bollinger band is now at the $5.66 level, and the lower Bollinger band is at $5.03. The Relative Strength Index (RSI) graph shows a downward slope, and the score has receded to 49.12 because of previous trends.
Uniswap price analysis conclusion
The one-day and four-hour Uniswap price analysis shows a rising possibility of an upturn in price. The bullish momentum gained stability in the past 24 hours, as the price stepped up to $5.41. Further improvement is to follow if the buyers show consistency with their efforts. The hourly price chart shows an increasing number of green candlesticks, a further indication of an upward trend.
Disclaimer. The information provided is not trading advice. Cryptopolitan.com holds no liability for any investments made based on the information provided on this page. We strongly recommend independent research and/or consultation with a qualified professional before making any investment decisions.


