Uniswap price analysis shows a bearish character. The UNI/USD pair price started declining from the start of the day; the bears started pulling the price down as selling pressure came in. Today the UNI/USD pair traded between $6.35 and $6.62, marking an intraday low of $6.35 and a high of $6.62. Either of the levels acting as support and resistance, respectively, May act as the trading mark for the coin if the price holds around the levels.
The UNI/USD pair is currently trading at $6.39, which is 2.30% lower than the previous day’s close of $6.41. The bearish mark has been dominant throughout the day and was able to break the aforementioned level of support at $ 6.35 as the sellers outpaced the buyers.
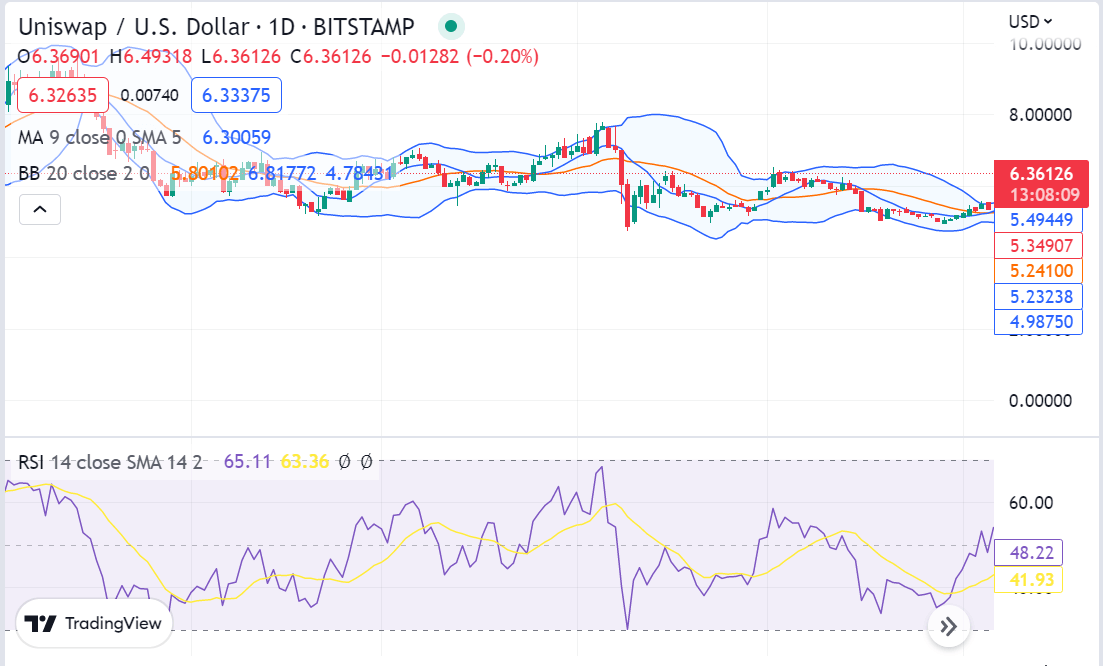
Uniswap price analysis 1-day price chart: Bears camping near $6.39
The 1-day Uniswap price analysis shows a bearish trend stopping the UNI from further climbing. The day started with a negative price movement when profit booking sellers rushed to sell the UNI assets, and the price dropped as low as $6.35, but then UNI bulls gathered strength and took the price up to 6.62. Currently, there seems to be a tough fight going on between buyers and sellers. The 24-hour trading volume of the coin is $108,223,829 and the market capitalization of UNI is currently at $4,870,493,973, which indicates the strong presence of buyers.

The volatility is comparatively high as the upper Bollinger band stand at $6.81, and the lower band stands at $4.78. The moving average is below the price level at the $6.300 mark. The RSI level is currently at 63.36, which shows that the momentum is still bearish and hints toward a short-term downward trend in the near future.
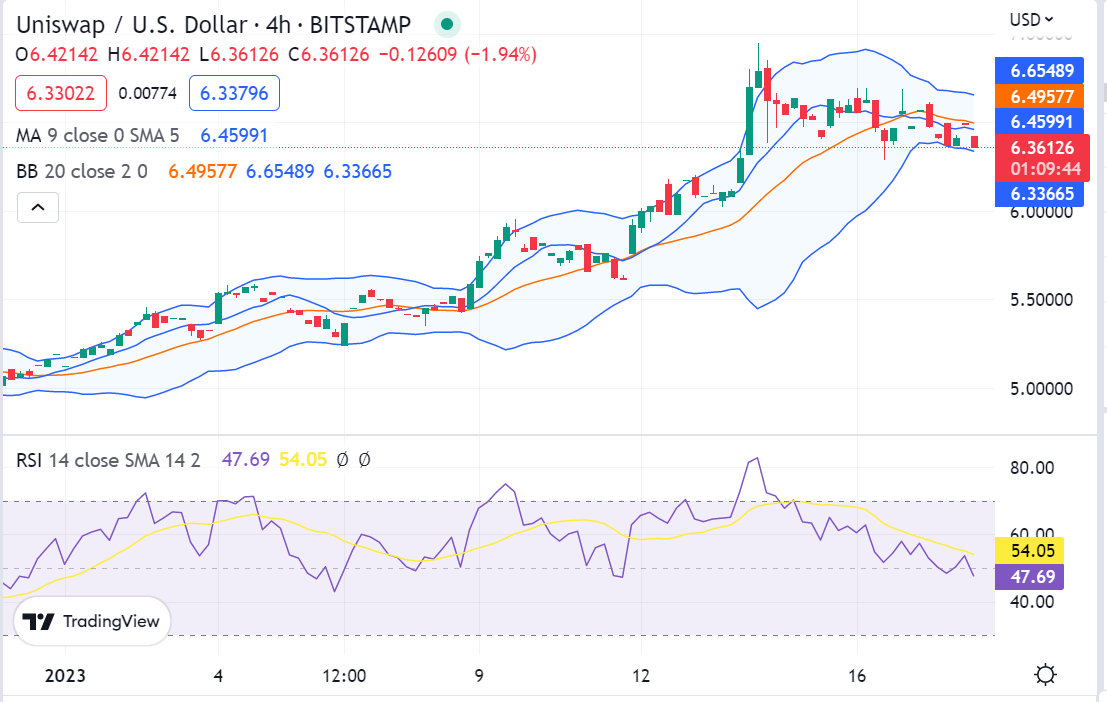
Uniswap price analysis 4-hour chart: Bears drag price further below
Looking at the hourly Uniswap price analysis chart, the price has been falling further below $6.39 as bearish sentiment prevails and there are no signs of a reversal seen in the near term. The buyers need to gather strength and break the resistance of $6.62 to completely turn the trend around in their favor.

The 4-hour chart moving average is also trending below the price level at $6.45, indicating a bearish crossover in the future if buyers cannot stop it. The Bollinger bands have tightened around the price level, which shows that volatility is low and the range of movement is confined. The upper Bollinger band stands at $6.65, while the lower Bollinger band is at $6.33. The RSI level is currently at 54.05, indicating that a minor bounce can be expected soon as momentum shifts toward the buyer’s side.
Uniswap price analysis conclusion
Uniswap price analysis shows that the bearish mark is dominating the market and pushing prices further below $6.39. The buyers need to gather strength to break the resistance at $6.62, otherwise, the bears may continue their downward push. The technical indicators also hint towards a bearish crossover in the near term if buyers are unable to pull the prices up. Therefore, traders should keep an eye on the market and make wise trading decisions before entering into any buy trade.


