Uniswap price analysis is on the bullish side today. The bulls have recovered a good range from the recent support level of $5.93, and momentum is growing stronger. The bullish momentum that started yesterday is powerful enough that it recovered the losses of the last two days. The price went as high as $6.22 at one point, but then the cryptocurrency started correcting and trading hands at $6.11 at the time of writing.

UNI/USD gained a value of a whopping 2.99 percent over the last 24 hours, which balances the loss incurred during the previous week. The broader cryptocurrency market is also bullish today as Bitcoin shows a three percent gain in value standing at $17,222, Ethereum shows four percent gains with a $1,280 price tag, and most altcoins also report bullish market sentiment, with Solana and Avalanche still topping the list, reporting 2.57 and 2.37 percent gains, respectively.
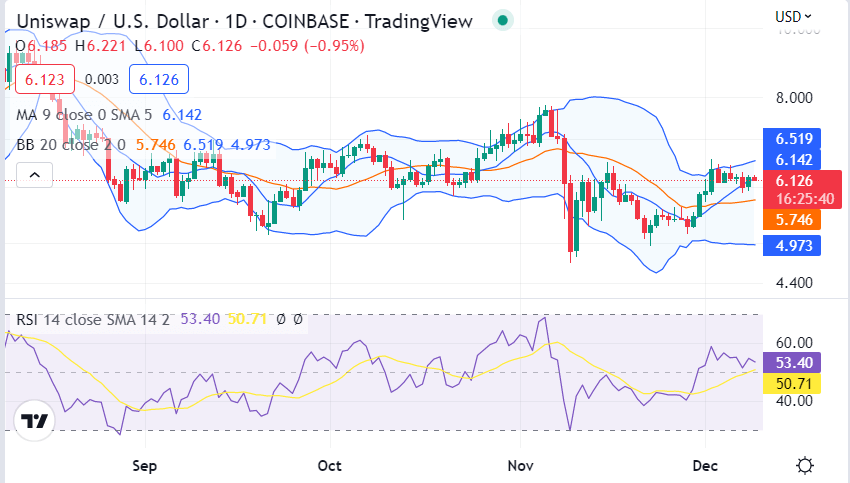
UNI/USD 1-day price chart: Can bulls surpass the resistance of $6.22?
The 1-day price chart for Uniswap Coin price analysis shows a significant increase in price. As UNI/USD is floating at the $6.11 level, selling pressure is also coming in from traders, who fear another short-term price drop after the steep spike in price.
The volatility is almost consistent, as is evident by the movement of the Bollinger bands, with the upper-end present at the $6.22 mark and the lower-end present at the $5.93 mark. The price has increased quite near the mean line of the Bollinger bands, which is present at the $6.11 mark.

The relative strength index (RSI) is almost at the center of the neutral zone at 50.71 indexes but shows an upwards movement, indicating still there exists some support to counter the selling pressure. While the indicator also shows quite a leeway for the buying activities to take place.
The MACD shows an increasing bullish trend as the histogram color is green. The outlook seems optimistic with the MACD line and signal both moving upwards. With UNI/USD price chart Bullish sentiments are building up, and it is likely that bulls could soon surpass the resistance level of $6.22 in the upcoming days, which could lead to further bullish momentum.
Uniswap price analysis: Upward strike leads the price to a $6.11 goal
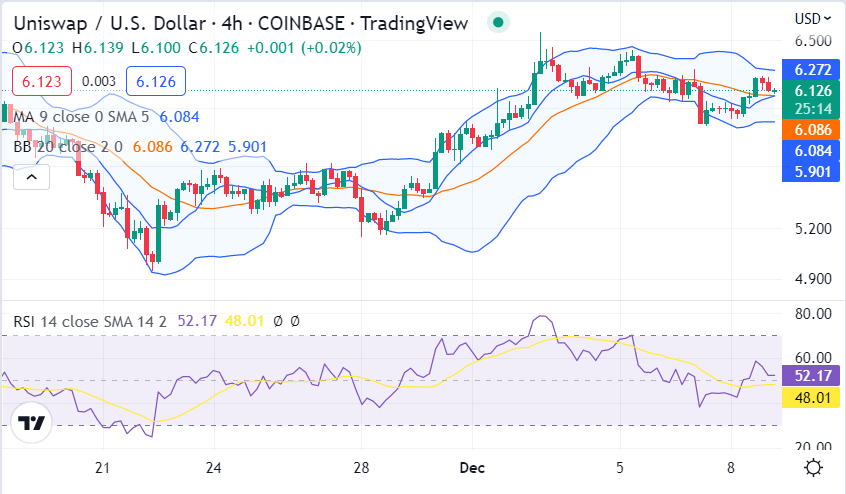
The hourly price chart for Uniswap price analysis is going in direction of the buyers as a bullish activity was observed during the past few 48 hours. The bullish momentum is gaining more and more stability and the price is progressing forwards. Currently, the cryptocurrency value has reached a $6.11 destination as a result of the upward sweep. Chances of further growth seem quite close as the bulls are standing firm.

The short-term trending line is now moving ascendingly because of the ongoing uptrend. Moving further, the Bollinger bands are making an average of $6.12, whereas their upper extreme is at $6.27 and their lower extreme is at $5.90. The RSI score is about to cross the overbought threshold, as it just reached the 48.01 level. The MACD is also shifting towards the positive region signifying a strong buy signal.
Uniswap price analysis conclusion
To sum up, the Uniswap price analysis today is showing bullish momentum. The bulls have been successful in recovering a strong range from the recent support level of $5.93, and there seem to be no signs of losing any steam soon.
Disclaimer. The information provided is not trading advice. Cryptopolitan.com holds no liability for any investments made based on the information provided on this page. We strongly recommend independent research and/or consultation with a qualified professional before making any investment decisions.


