The Uniswap price analysis indicates that the bears are dominating the market. UNI/USD has been trading between $6.15 and $6.65 levels for the past few days without any major price movements.

Uniswap is currently trading at $6.25, whereby selling pressure is strong and currently pushing the pair down. The sellers are likely to take control of the market if the $6.15 support level is breached, and UNI/USD could sink further.
On the upside, there is resistance at the $6.65 mark which indicates that bulls are unable to break past this level. If this resistance fails, then Uniswap will be able to find some support, and its price may increase.
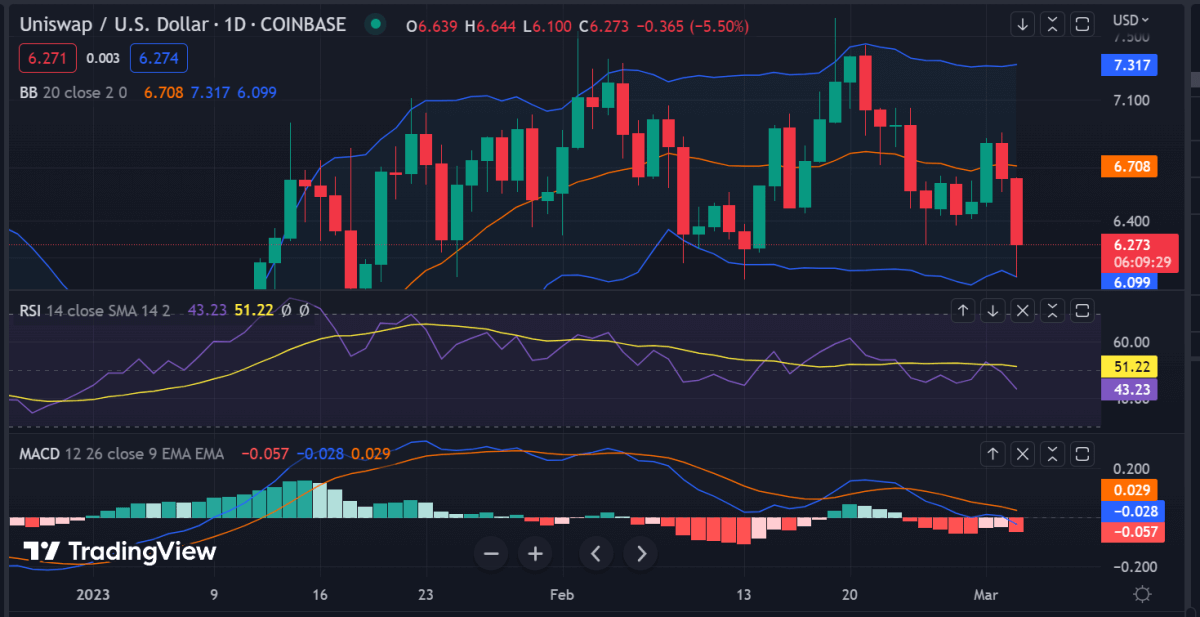
Uniswap price analysis 1-day chart: Bearish pressure is strong, with resistance at $6.65
The Uniswap price analysis on the 24-hour chart shows that the bears are still in control of the market. The price has been declining over the past few days and is currently trading at a more than 5.35% drop from the last day’s high. The bulls were in control for the past few days, but now it seems that the bears have taken over. The market cap for Uniswap is currently measuring around $4.78, and the 24-hour trading volume stands at $95.

The technical indicators are showing bearish signals. The RSI is currently around 34 and is heading lower, indicating further bearish pressure and downward momentum in the market. The Bollinger bands are narrowing, which suggests that the market volatility is decreasing. The upper Bollinger band is currently around $6.20, whereas the lower Bollinger Band is at $6.15. The moving average indicator is also in favor of the bears, as it is trending below the price.
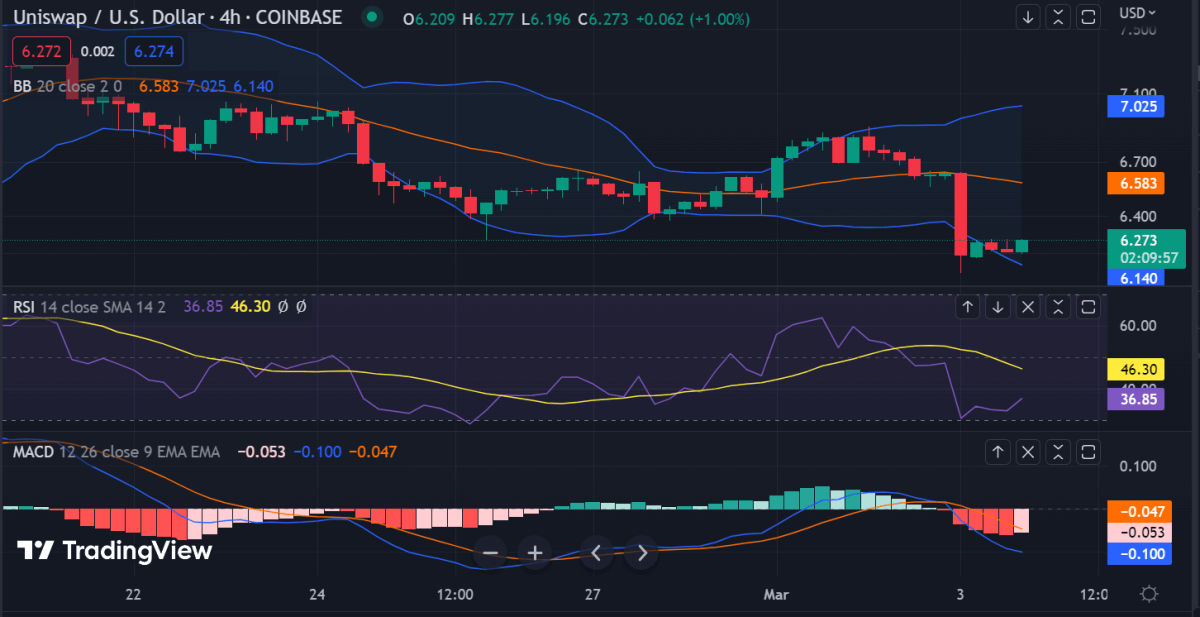
Uniswap price analysis 4-hour chart: Recent updates
The 4-hour Uniswap price analysis confirms over the last few hours that the bears are more dominant than the bulls. The price has declined sharply from $6.65 to $6.25 and is currently trading at this level. The red candlesticks on the chart increase as more selling pressure is being seen from the market participants.

The hourly technical indicators are also in favor of the bears. The Relative Strength Index (RSI) is currently trading at 33 and heading lower, indicating that the sellers have taken control of the market. Similarly, the upper and lower Bollinger Bands are at $6.15 and $6.30, respectively, which suggests that the market is entering a bearish phase. The 4-hour moving average is currently at $6.22 and trending downwards, which further confirms bearish sentiment.
Uniswap price analysis conclusion
To sum up, the Uniswap price analysis shows that bears are still in a dominant position. The UNI/USD pair is trading around $6.25 with strong selling pressure and resistance near the $6.65 zone. The support level is currently at $6.15, and if this fails, then the pair could sink further. The 4-hour Uniswap price analysis also confirms bearish pressure in the market, with all technical indicators pointing downwards.


