Uniswap price analysis shows alarming signals of a downturn as the price has been trending downward over the past day. Despite the fact that the cryptocurrency was bullish earlier this week, bears have grabbed control and dragged UNI/USD prices down to $6.48 at the time of writing. The altcoin’s current support level of $6.39 and resistance level of $6.69 could act as pivot points for the next price movements. The large decline that has had a negative effect on the overall value of cryptocurrencies over the past few hours, however, has made the bears fairly successful. The market is expected to remain volatile as the day comes to a close. The UNI/USD pair is currently trading at $6.48 and is down by 1.99% on the day. The trading volume sits at $97.7 million, while the market cap is at $4.93 billion.
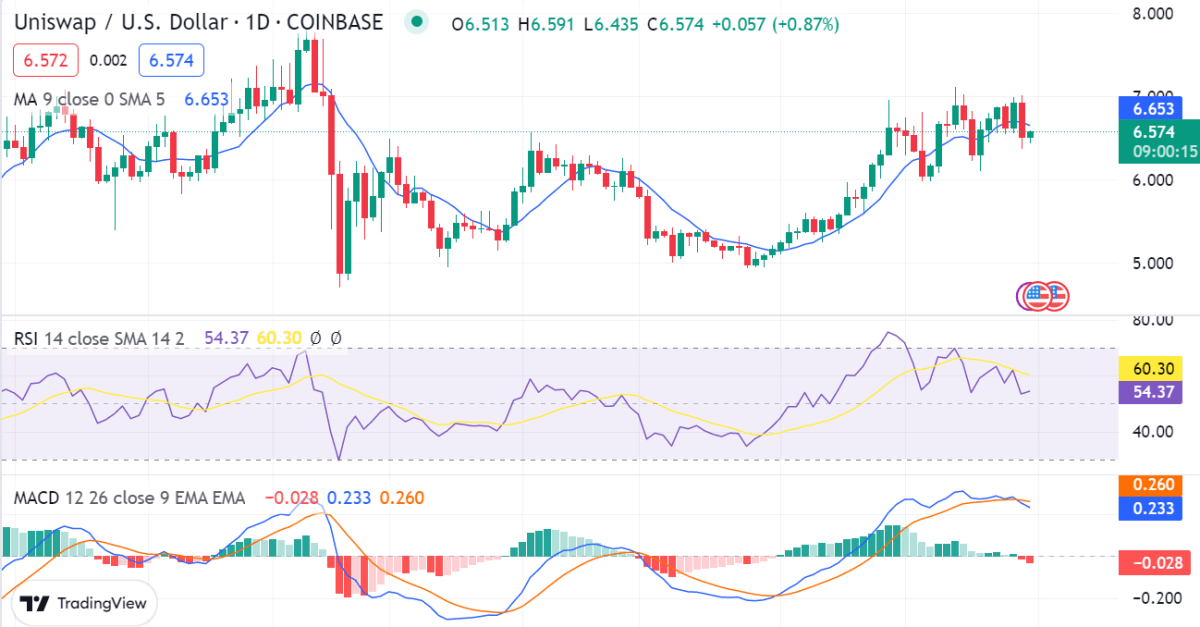
Uniswap price analysis 1-day chart: Price stumbles at $6.48 as bearish signal continues
Uniswap price analysis demonstrates that the UNI is signaling a drop in coin value because the price has been moving in a bearish direction all day. Given that the UNI market price has been steadily rising over the past few weeks, the situation is starting to favor the sellers. However, there was a decline in price today, which is why the price has dropped to the $6.48 level, a fall of 1.99 percent over the previous day.

The 50 SMA and 100 SMA are both below the current UNI/USD trading price, indicating that bears have control of the market and a potential decrease in price may occur. More importantly, the Relative Strength Index (RSI) score has moved down to the neutral zone at 60.30, which indicates that buyers are losing their grip on the market and bearish forces are dominating. The moving average convergence and divergence (MACD) level is currently moving into negative territory, with the signal line falling beneath the MACD line.
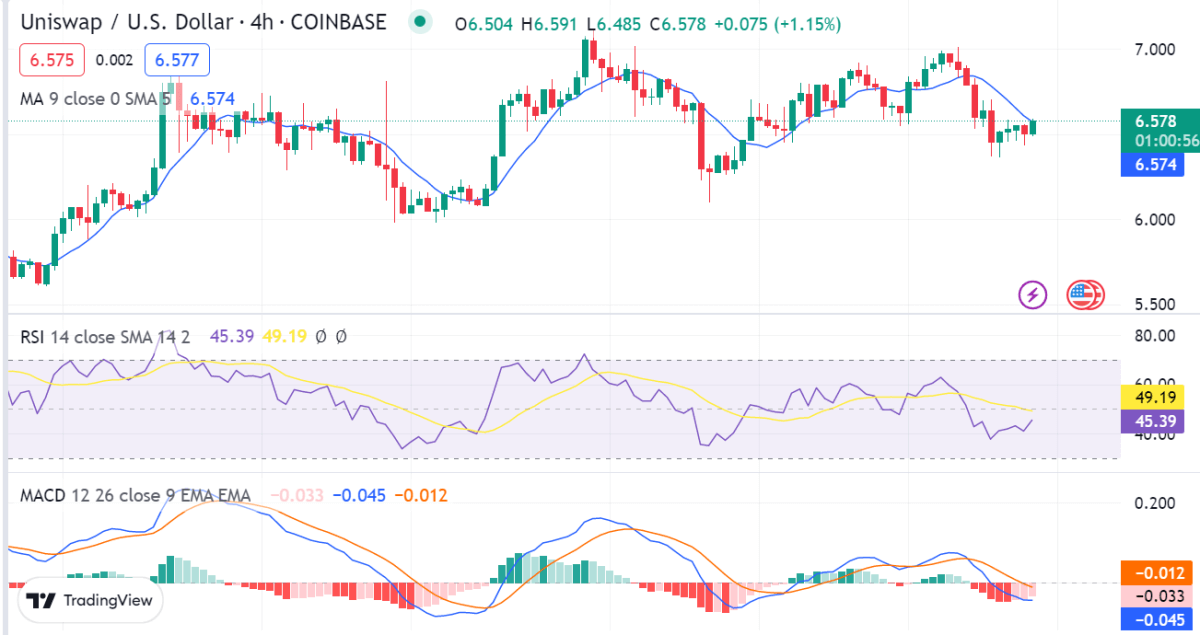
UNI/USD 4-hour price chart: Latest development
Uniswap price analysis on a 4-hour chart shows that the prices are still heading downward and reached $6.48 at the time of writing. The short-term trending line has been descending, and the bears have been showing control over the market for the past few hours. The last four hours have been detrimental to cryptocurrency value, with the price falling noticeably. Therefore, the market’s volatility is increasing in response to a movement, which indicates that Uniswap’s price is increasingly likely to undergo a variable shift on either extreme.

The relative strength index (RSI) indicator is below the 50 level, which indicates that the market is currently in a bearish trend. The moving average convergence and divergence (MACD) line is currently in a bearish zone as the price looks to continue its downward trend. The MA 50 is currently in a bearish trend as the price looks to continue its downward trend.
Uniswap price analysis conclusion
Uniswap’s price analysis shows that the prices are declining as they go below the $6.48 threshold. As buyers rush in to defend this crucial level, prices have now found support at the $6.39 level. The vast range of price changes makes the market extremely unstable. As they attempt to drive prices lower, the bears are thought to be in charge of the market.


