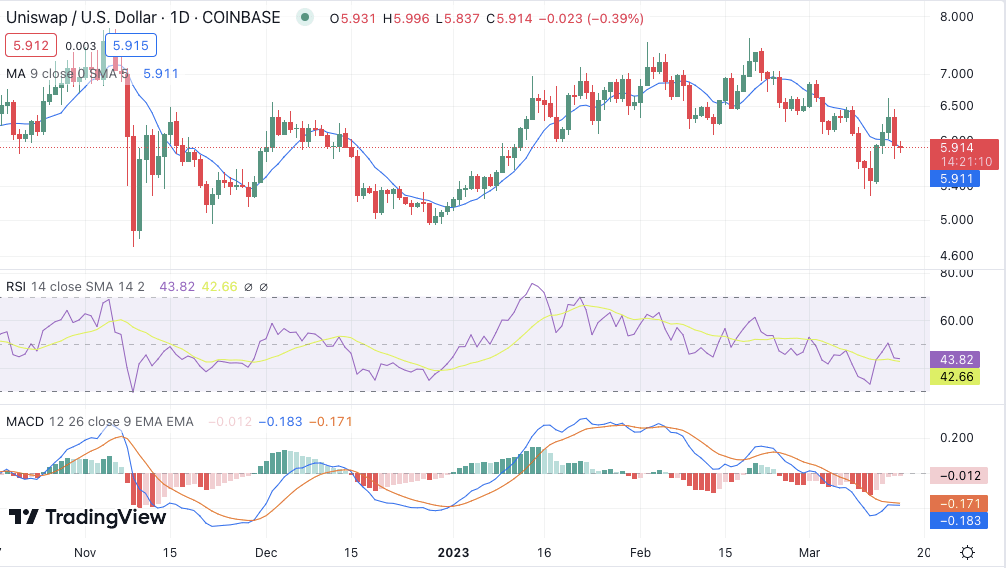
Uniswap price analysis shows that the UNI/USD has been trading in a bearish trend line for the past 24 hours. The bearish momentum is seen as a double-top pattern with resistance at $6.38, which is unlikely to be broken anytime soon. The current price of UNI is at $5.93, and it has depreciated by 6.87% over the past 24 hours.
The short-term price action suggests that UNI is likely to undergo a correction and reach levels of $5.79 before bouncing back up. On the upside, if the resistance level of $6.38 is broken, then it will open doors for further uptrends with higher highs and higher lows in the near term.
The bulls and bears are in a tug of war, with the bears trying to keep prices at bay. However, the buying pressure has been increasing in recent days. In the event of a breakout, it could see UNI reach a high of $8.86. However, for now, UNI will have to consolidate near the current market prices and wait for a breakout before any sudden moves can be seen.
UNI/USD 1-day price chart: Bearish strike deflated the price to the $5.93 level
The 1-day Uniswap price analysis is showing a downtrend for the price function once again. The bears have managed to secure a win in the last 24 hours as the price has undergone a reduction up to $5.93. Although the bulls were able to sustain their lead in the past few days, today’s trend has been strongly on the bearish side yet again. The recent defeat has marked the price below the moving average (MA) level at $5.91.

The RSI curve is at 43.82 as the coin nears the supply area. At present, the RSI curve has crossed the oversold zone and is likely to have a bearish impact in the coming days. The MACD histogram is also showing strong red bars, indicating that the bears are dominating the market at this point. The MACD line has also crossed the signal line, which suggests that there is still room for further downward movements.
Uniswap price analysis: Bearish pressure expects to push UNI prices toward $5.79
The 4-hour Uniswap price analysis confirms that a bearish trend has been at its peak. The bears have maintained their lead quite efficiently by bringing the price down to the $5.93 level. The price might move towards a new low, and the bearish momentum seems to be intensifying every hour. The moving average is still quite high and is settled at the $6.06 position for now, with 20-SMA being slightly above it.

The MACD indicator has given a negative crossover as the coin gave a breakout of the descending channel. The red line is also trending lower, which indicates that the selling pressure might prevail for a while. Moreover, the RSI curve is at 45.36, and it might hit the oversold zone soon if the current bearish trend persists.
Uniswap price analysis conclusion
The Uniswap price analysis shows that the coin is currently trading in a bearish trend. The bears have managed to keep the UNI prices under control and are likely to push them toward $5.79. Although there is potential for a short-term rally if the double top holds; however, it remains uncertain at this point.


