Uniswap price analysis shows that the price is currently in a bullish trend as it has broken out of the descending triangle formation. The next level of resistance is at $6.49, and if the price can sustain its current momentum, it is likely to test this level in the near future. However, if the price starts to retrace from its current levels, support is likely to be present at $6.10.
The digital asset has been on bear in recent hours. However, the recent surge in buying pressure has allowed it to break out of its current downtrend. This could be a sign that the bulls are starting to regain their strength and may push the price further up in the coming days. The market cap for the digital asset is currently standing at around $4.8 billion, with a 24-hour trading volume of $100 million.
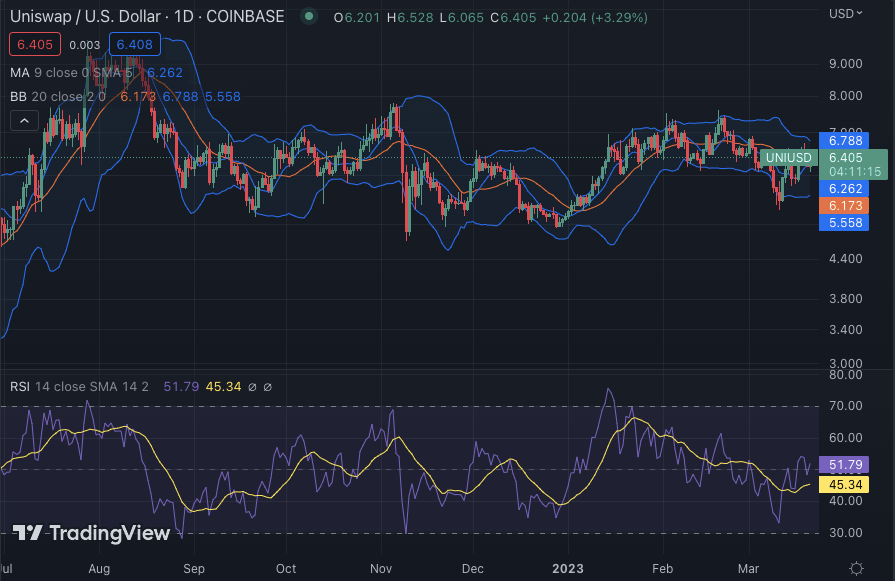
UNI/USD 1-day price chart: Bulls successful in making a comeback
The one-day Uniswap price analysis confirms a bullish trend for today as the coin value has undergone a considerable improvement. The circumstances are in support of the bulls as the price covered an upward movement up to $6.40 from the opening value at $6.10, up 1.33% in sight of the market’s optimism and bullish sentiments.

The bulls are attempting to take over control of the market as the Moving average indicator shifted to the bullish region. The 50-day MA line stands at $6.26, and the 20-day MA is placed at $6.35, heading in the north direction. The volatility in the one-day price chart is comparatively high, with the upper Bollinger band at $6.78 high and the lower Bollinger Band at $5.55 low. The RSI indicator is on the bullish side, neutral zone at 51.79 and heading further upwards.
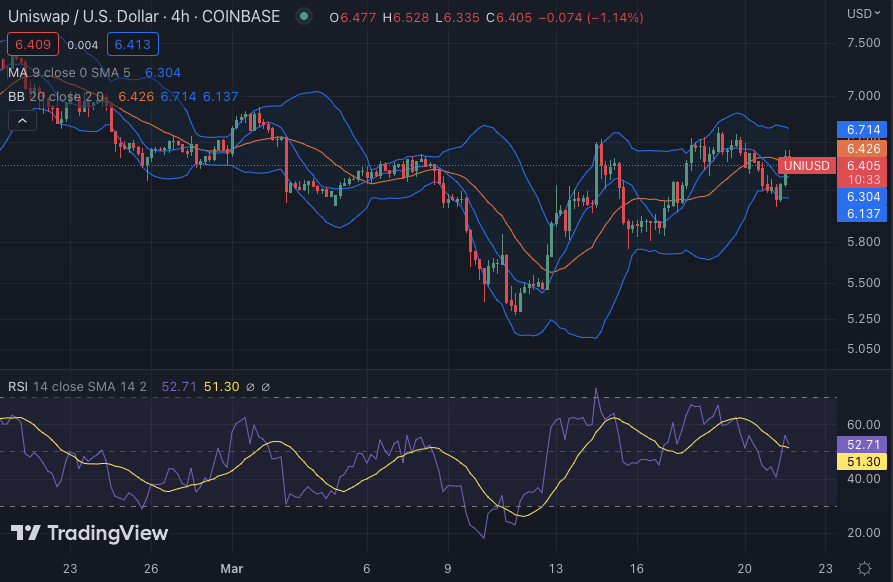
Uniswap price analysis: Bulls need to break the resistance
The 4-hour Uniswap price analysis favors the bullish side as a strong rise in UNI/USD value was detected in the past few hours. The bulls have been dedicated to rewin their leading position in the market, and so far, their progress has been fascinating. The price experienced a rise to $6.40 in the last four hours because of the bullish trend.

At the same time, the moving average is trading at $6.30, just below the price level. The Bollinger bands are also in favor of the bullish trend, as the upper band is located at a $6.71 high, and the lower band stands at a $6.13 low. The Relative Strength Index (RSI) also takes the side of the bulls, with a neutral reading of 52.71.
Uniswap price analysis conclusion
The bulls are controlling the market today; as confirmed from the above one-day and four-hour Uniswap price analysis, the increase in the price level has been supporting the idea of a bullish trend. The resistance level at $6.49 could prove to be crucial in the upcoming days. If the bulls can successfully break it out, then more upside is expected in the market.


