Uniswap price analysis shows a downtrend today as UNI/USD price consolidates $6.89.The market is expected to see lower prices as the bearish pressure continues. Price has currently set a new support level at $6.73 while it faces resistance at the $7.10 mark, which is just above the current market price. The trading volume for the coin is at $164,757,320, while the market capitalization is at $5,254,055,956, and the total market dominance is 0.38 percent of the price value, ranking position #17 in the overall cryptocurrency market.
UNI/USD 1-day price chart: Uniswap price face resistance at $7.10
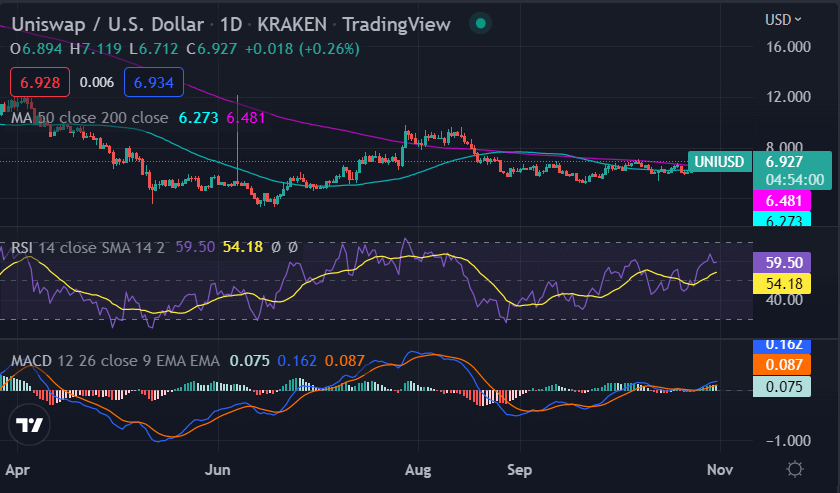
Uniswap price analysis for 24-hour price charts indicates a bearish signal. The market is expected to see some consolidation in the near term as the bulls and bears battle for control of the market in a 24-hour price chart. Prices are low at the $6.89 level and high at $7.10. The bulls were in control earlier today, pushing the price up to $7.02, however, they were unable to sustain their momentum and were quickly overtaken by the bearish pressure.

Looking at technical indicators, the Relative Strength Index is currently at 54.18, indicating a neutral market sentiment. The MACD also shows bearishness as it signals a downward trend in the market. The 50-day moving average has crossed below the 200-day moving average, indicating a potential downtrend in the market.
Uniswap price analysis on a 4-hour price chart: Latest updates
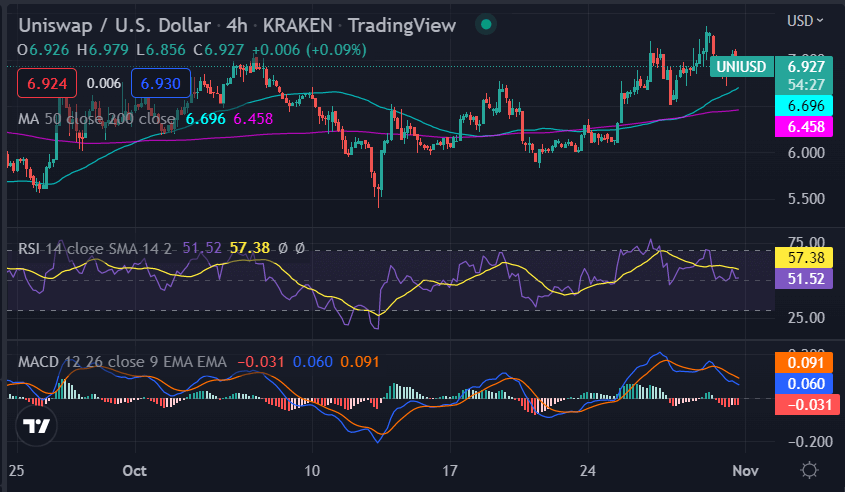
The 4-hour Uniswap price analysis shows that prices have been consolidating below the $7.10 resistance level as prices confirm that a downtrend has occurred for the past few hours. The drop in price was quite drastic as the price levels decreased rapidly. The bearish is likely to continue as the market sets a new support level at $6.73.

The 50-day moving average is currently at $6.45 while the 200-day moving average is at $7.10, indicating that a downtrend has occurred in the market and prices are expected to continue dropping. The relative strength index is at 57.38, just slightly leaning toward the bearish sentiment in the market. The MACD line is also below the signal line, confirming a bearish trend in Uniswap’s price.
Uniswap price analysis conclusion
Uniswap price analysis reflects a bearish market sentiment as prices, one-day and four hours price charts are predicting a downward trend by giving a lead to the bears. The trends are also expected as the selling momentum has gotten sharper in the coming hours. But we expect the downfall to be of controlled nature.
Disclaimer. The information provided is not trading advice. Cryptopolitan.com holds no liability for any investments made based on the information provided on this page. We strongly recommend independent research and/or consultation with a qualified professional before making any investment decisions.


