The most recent Uniswap price analysis shows that UNI/USD value has fallen to $5.16 as a result of a negative trend. The $5.25 level, a crucial support level that was breached yesterday, is where the market is currently trading. There is a probability that the market will find support and move back up if it can maintain its position above the $6 mark. However, the market is expected to go in the direction of the $5 level if it breaks below the $5.1 level.
As selling pressure increases, the UNI/USD pair’s market as a whole is declining. The digital asset dropped by roughly 3.21 percent in the previous day, and the UNI/USD pair is displaying a strong bearish momentum. The digital asset’s market cap has also decreased, and it is now worth $3,924,961,403 while its 24-hour trading volume is $136,908,882.
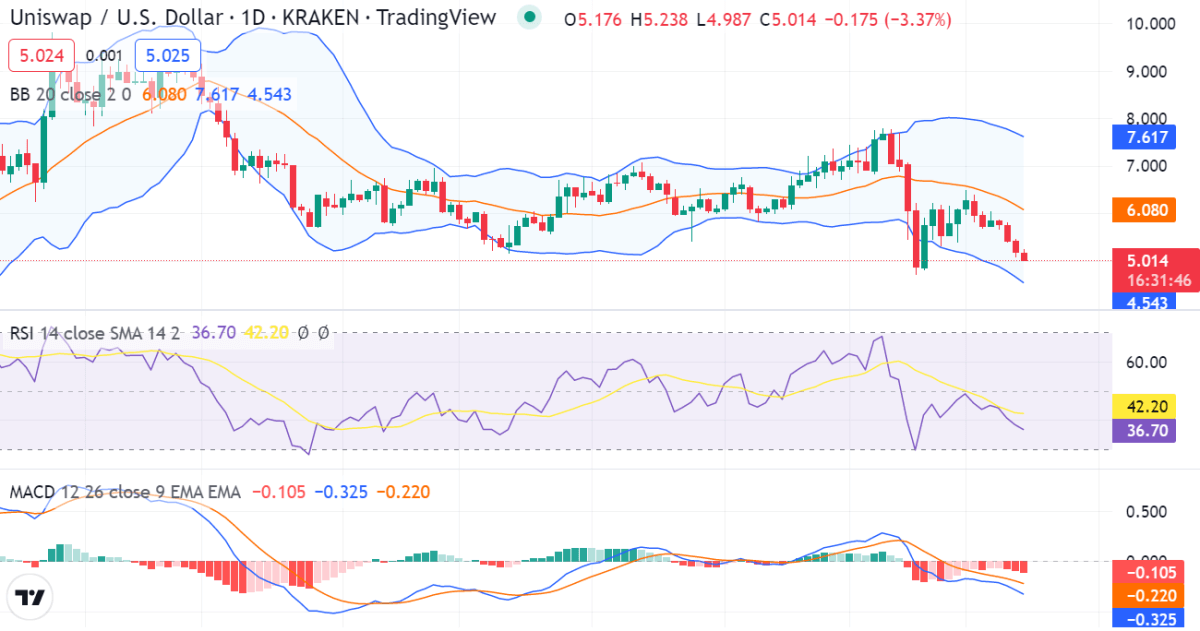
UNI/USD 1-day price chart: Bearish trend intensifies as price depreciates up to $5.15
The one-day Uniswap price analysis shows that the 24-hour trading volume for the UNI/USD pair has been on a declining trend. If the bears can take control of the market, we may see prices move down to the $5.0 level as the price is now trading at the flag’s support level, which is approximately $5.12. On the other hand, $5.43 serves as resistance, and a break above it is required for the bulls to seize the initiative in the market. The MACD indicator shows that the MACD line is currently below the signal line signaling a developing bearish retracement.

On the technical front, the volatility can be seen to increase following the enlarging of the Bollinger Band indicator. Precisely, the lower limit is placed on the $4.58 mark while the upper band is placed on the $7.617 which serves as the highest mark the price has reached in the near past. The RSI score is currently 42.20 which reveals the pressure from the bears is intensifying.
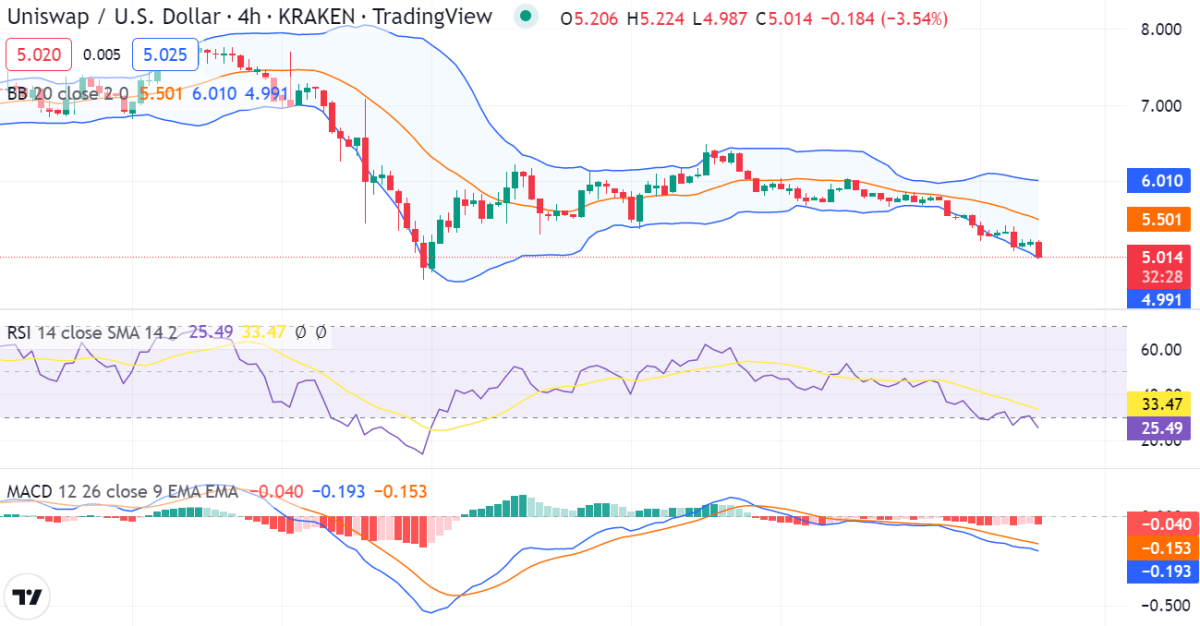
UNI/USD 4-hour price chart: Recent developments and further technical indications
The four-hour Uniswap price analysis shows that the UNI/USD pair is in a downward trend and is currently trading at $5.14. The price has fallen below the $5.16 level and is facing resistance at $5.14. The price has been covering a range downwards from the start of the trading session and even in the last four hours, after getting a breakout downwards today.

The four-hour chart shows that the UNI/USD pair is trading in the oversold region as the RSI indicator is approaching the 30 levels. The bands of the Bollinger Band indicator shows increasing volatility proving that this trend may end soon if the bulls appear. The MACD indicator is currently in the bearish momentum as the signal line(red) is above the MACD line(blue).
Uniswap price analysis conclusion
Uniswap price analysis reveals that the UNI/USD pair is in a negative trend as prices fall below the $5.43 mark. As buyers go in to defend this crucial level, prices have just found support at the $5.12 level. Due to the large range of price fluctuations, the market is very erratic. As they attempt to drive prices lower, the bears are thought to be in charge of the market.
Disclaimer. The information provided is not trading advice. Cryptopolitan.com holds no liability for any investments made based on the information provided on this page. We strongly recommend independent research and/or consultation with a qualified professional before making any investment decisions.


