The recent Uniswap price analysis reveals that the digital asset has seen an increase in momentum as it seeks to recover from its recent dip which saw the price dip touching the $5.20 level. UNI opened its trading session at the $5.50 level and the bulls have been steadily pushing the price higher to hit the $5.59 mark.
Resistance is being seen at the $5.59 mark, however, should UNI break this level, it could open up further buying opportunities for investors and traders. The support for UNI/USD has been present at the $5.46 mark and given that there is some upside momentum behind the pair, this means that a break of the $5.59 level could be possible.
Uniswap price analysis daily chart: Bulls drive the momentum in the UNI/USD pair
The daily chart for Uniswap price analysis shows that the pair has been in a steady uptrend since it hit its intraday low at $5.46. The bulls have been gradually pushing the price up forming an ascending channel pattern which is indicative of further upside momentum. Currently, UNI is trading at the $5.58 level which is its highest point in this uptrend, and has seen an increase of 1.18% in the past 24 hours.
The technical indicators are all pointing to a bullish revival for the digital asset and given the recent price action, it is likely that UNI will see further gains in its near-term outlook. The Relative Strength Index (RSI) suggests that there is some buying pressure behind the pair as it pushes the index from the oversold region towards the neutral region with the current value at 42.68.
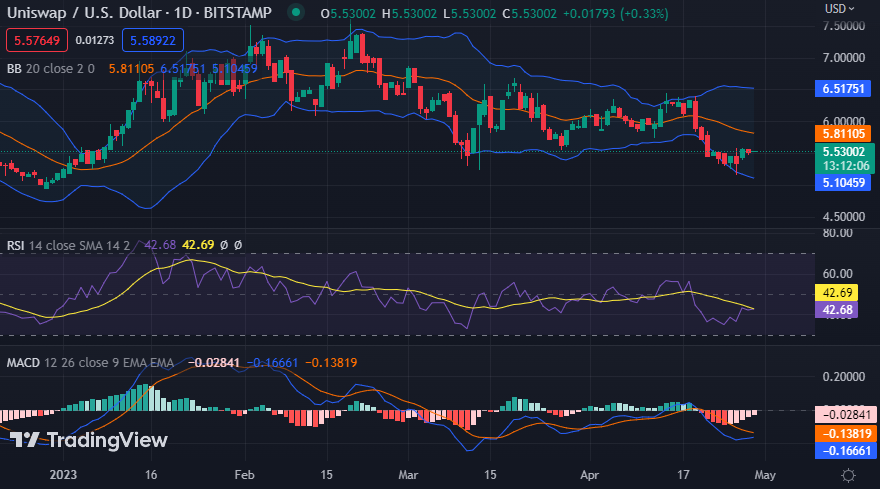
The Bollinger Bands show some widening which suggests that the volatility in the market could be increasing, however, with the current price action it is expected that UNI will continue to see further gains. However, the MACD indicator is still in the negative territory but exhibiting bullish signals as the MACD line is moving towards crossing over the signal line with the red bars reducing and fading away from the histogram.
Uniswap price analysis hourly chart: Bulls maintain their grip to break the resistance
The hourly chart for Uniswap price analysis shows that the bulls have been able to maintain their grip despite some sideways trading in the past few hours. The prices have been moving within a narrow range of $5.56 and $5.59, however, the buyers are now looking to break this resistance and push the prices higher.
The technical indicators on the hourly chart suggest that there is further upside potential for UNI/USD with some buying pressure coming into play. The RSI has crossed the 50 index and is currently seen at 52.72 which suggests that UNI is trading in a neutral zone but could see further gains in the near term.
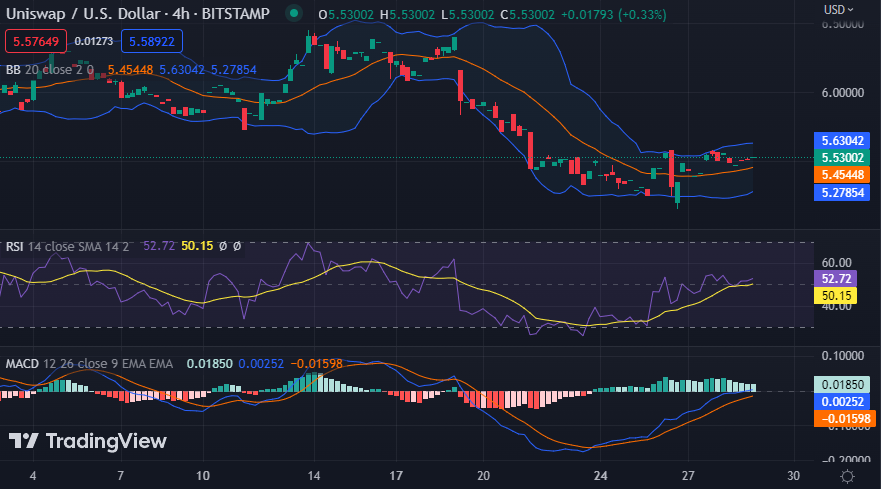
The MACD indicator shows a positive outlook as the MACD line is seen moving above the signal line with green bars on the histogram showing more buying pressure. The Bollinger Bands have narrowed a little bit as the price is finding for a breakout with the Bollinger average still below the current price
Uniswap price analysis conclusion
In conclusion, it is expected that Uniswap will continue to see further gains if it can break through the resistance at $5.59, which could open up buying opportunities for investors looking to capitalize on this surge in UNI price action. The support level of $5.46 should also be taken into consideration and if UNI loses this support, it could indicate a bearish trend in the near term.