The Uniswap price analysis reveals that the price has been following a downward movement for the past few days, as the bears have been continuously at the lead, and the price function is headed downwards. The short-term price trend line is also descending as a regular decline in price has been taking place since the start of this week. The price has been lowered to the $5.28 level as a result of the latest bearish strike. Further downfall in price is to be expected in the coming hours as well.
Uniswap price analysis 1-day price chart: Bears maintain a downward trend
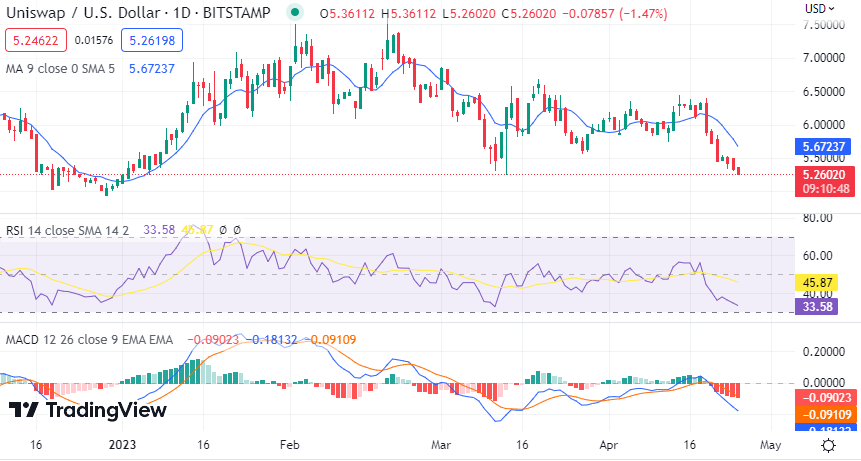
The 1-day Uniswap price analysis shows the token has traded in a range of $5.26 to $5.42 today, while the token is trading hands at $5.28 at the time of writing with a decrease of 2.34% in the last 24 hours. The bears have been dominating the market, and a downward trend is being maintained for the UNI/USD pair. On the other hand, the trading volume has decreased by more than 14 percent resulting in the bears taking control of the market.

The daily technical indicators point to a bearish trend as the MACD and RSI are both showing negative readings. The current momentum suggests that the price could decline further in the near future. The MACD is headed downwards, and its signal line has crossed below the MACD line, indicating bearishness. The 50-day and 200-day moving averages (MA) are heading downwards, indicating a bearish market. The RSI is at 33.58, which indicates that the bears have taken dominance over the token’s movement in the near term.
Uniswap price analysis: Recent developments and further technical indications
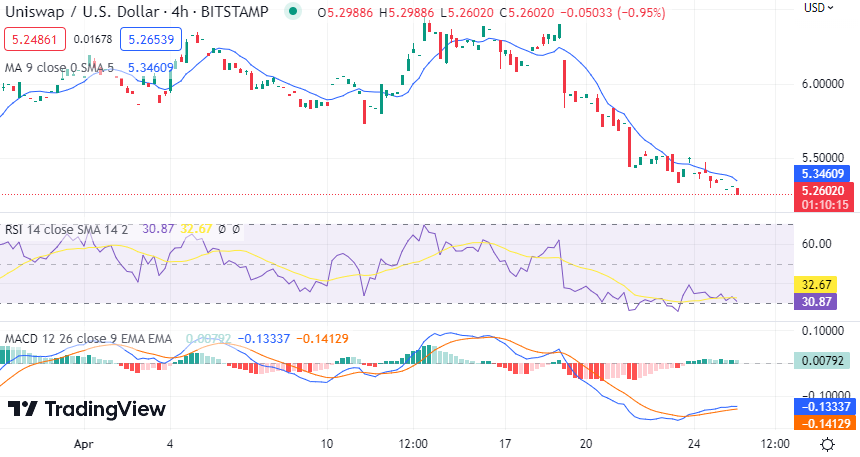
A considerable decline in Uniswap price analysis has been observed since yesterday. The price has gone below the $6.00 level which indicates that the bears have taken control of the market. The current support level is present at $5.26, and if the price breaks this level, then further downfall will be expected in the near term. On the other hand, there are some major resistance levels placed at $5.42, and if UNI/USD crosses above it, then the bulls will take control of the market.

The recent technical indicators all point to a bearish trend in Uniswap price analysis. The moving average converge divergence (MACD) indicator is in negative territory, and the signal line has crossed beneath the MACD line to indicate a bearish market. The relative strength index (RSI) is at 30.87, which suggests that UNI/USD may continue to move downwards in the near future. The moving average indicator is currently at $5.34, which suggests that the bears are in control of the market and may continue to push prices lower.
Uniswap price analysis conclusion
The Uniswap price analysis is confirming a downtrend for the day, as the price has undergone a significant decrease in the last 24 hours. Bears have been leading the price charts for the past few days, and even today, a downward tendency has been shown by UNI/USD. The recent bearish trend is expected to continue unless the bulls manage to take control of the market.


