Uniswap price analysis shows a bearish trend as the price has fallen below the $6.00 mark. The support for Uniswap prices is present at $6.6.04, and the resistance is seen at $6.61. The UNI/USD pair has been on a downward trend for the last 24 hours as it is currently trading at the $6.20 mark. The overall market for the UNI/USD pair is in decline as selling pressure intensifies, Uniswap price is showing a solid bearish momentum as the digital asset declined by nearly 6.02% over the past 24 hours. The market capitalization of Uniswap has also declined to $4,728,396,083, and the 24-hour trading volume is at $212,198,611.
Uniswap price on 1-day analysis: Price levels descend to $6.20 boundary after a downswing
The Daily chart for Uniswap price analysis shows that the coin is following a clear downtrend as it has made lower lows and lower highs. The prices have been stuck between $6.04 and $6.61 levels for the past few hours, and a breakout is needed for the trend to continue. The MACD indicator on the 1-day chart is currently in the bearish zone as well. This indicates that the momentum is in favor of the bears and a further decline can be expected.

The Moving average indicator on the 1-day chart is currently in the bearish zone as well. The 50-day MA line is currently at $6.64, and the 200-day MA line is currently at $603. This indicates that the path of least resistance is to the downside and a further decline can be expected in the prices of Uniswap. The RSI indicator on the 1-day chart is currently at 42.66 and is showing no signs of a bullish reversal.
Uniswap price analysis on a 4-hour price chart: Price goes down to $6.20 after bearish drift
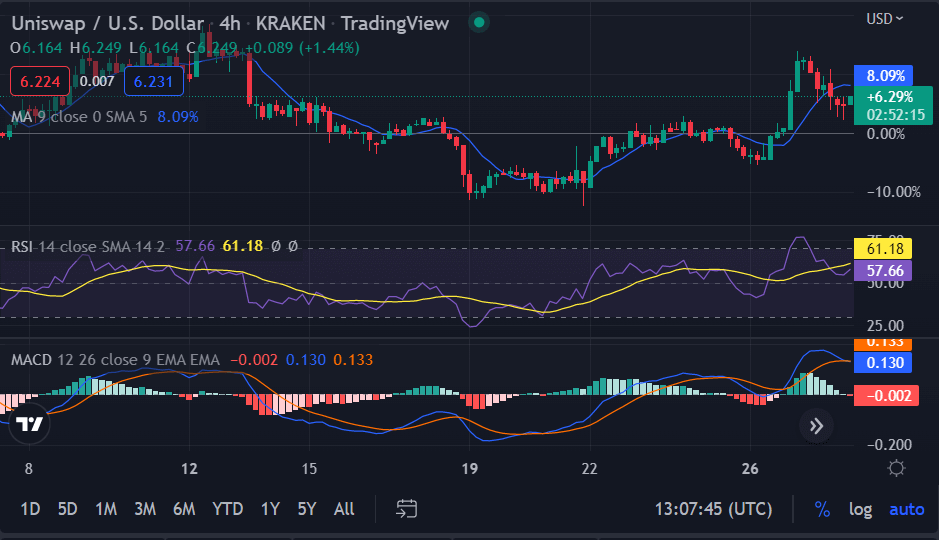
On the 4-hour chart, Uniswap analysis has formed a bearish flag pattern which is a continuation pattern. The price is currently trading at the support of the flag which is around $6.04. The buyers will need to push the prices above the $6.61 level to take control of the market. If the bears can take control of the market, we can see prices move down to $6.04.

The RSI indicator chart is currently below the 61.18 level which is a bearish sign. This indicates that the selling pressure is currently increasing in the market. The MACD line (blue) on the 4-hour chart is currently moving below the signal line. The MA 50 and 200 lines on the 4-hour chart are both currently in a bearish trend as well. The 50 MA is at $6.61, and the 200 MA is at $6.04.
Uniswap price analysis conclusion
Uniswap price analysis shows that the UNI/USD pair is in a bearish trend as prices decline below the $6.61 level. Prices have recently found support at the $6.04 level as buyers step in to defend this key level. The market is highly volatile as prices fluctuate in a wide range. The bulls are seen to be stumbling to defend the $6.00 level as selling pressure intensifies. The bears are seen to be in control of the market as they aim to push prices lower.
Disclaimer. The information provided is not trading advice. Cryptopolitan.com holds no liability for any investments made based on the information provided on this page. We strongly recommend independent research and/or consultation with a qualified professional before making any investment decisions.


