Recent Uniswap price analysis for today shows that the market is showing a bullish trend and pushing toward higher levels. The market opened today’s trading section in bullish momentum, pushing from the support at $6.46 to a high of $6.64 but then failed to break it and pulled back towards the support level. However bearish pressure came across and the price was pushed down to $6.46 in the late hours of trading, but it has been steadily increasing since then.
At the time of writing, Uniswap is trading at $6.51, indicating a 0.52% gain over the past 24 hours which is impressive when compared to other digital assets. The more buying pressure is increasing with trading volume also increasing, UNI/USD is expected to go further up in the near future. The market capitalization of Uniswap is also increasing, currently standing at $4.96 billion, and the 24-hour trade volume is around $84 million.
Uniswap price analysis 1-day price chart: UNI shows bullish momentum at $6.51
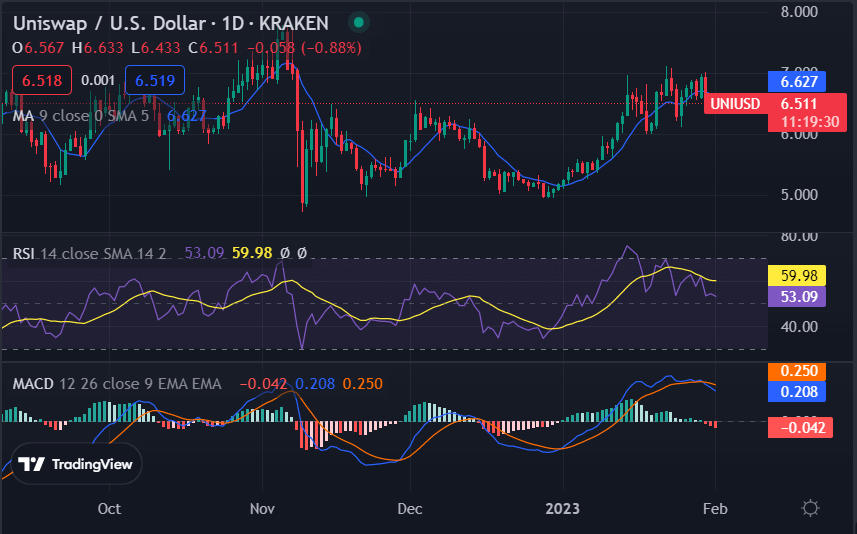
The one-day chart for Uniswap shows a clear bullish trend with the price constantly pushing toward higher levels as mentioned before. The chart also displays strong support at $6.46 which buyers need to break in order to send the price further up. Furthermore, there is resistance at $6.64 where Uniswap was rejected earlier, and investors must overcome this obstacle in order to send UNI/USD higher.

The 50-day simple moving average (SMA) and the 200-day SMA are also trending upwards, indicating an overall bullish sentiment in the market. The RSI indicator is currently at 59.98, showing an increase in buying pressure and potentially sending UNI/USD higher during the next trading sessions if buyers continue to enter the market. The MACD indicator has given a positive crossover as the coin gave a breakout of the supply zone. The blue line crossed the orange line on the upside. This has resulted in the coin price moving up strongly in a 24-hour time frame.
Uniswap price analysis 4-hour chart: Recent updates
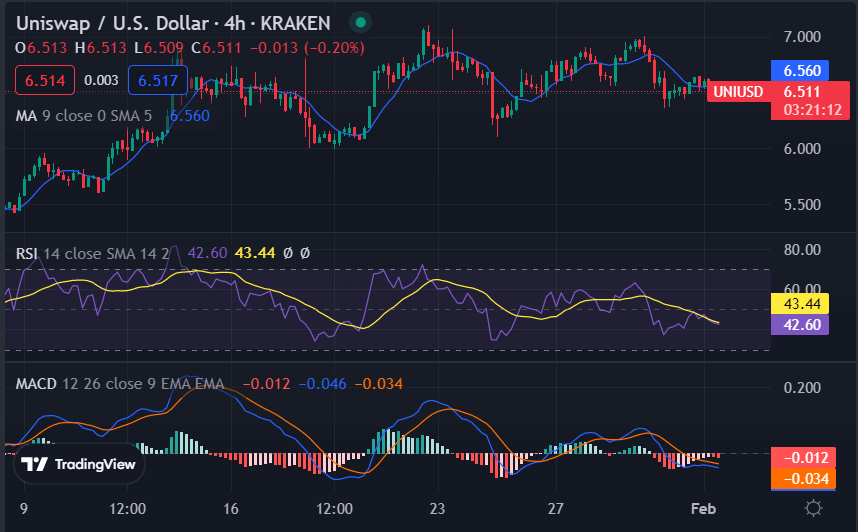
Looking at the hourly chart, it shows that Uniswap’s price analysis has been trading in an uptrend since the start of today’s trading session, Despite the rejection at $6.64, the price is currently trading at a higher level and continues to be bullish in the near-term. The market has formed a higher high pattern which is a sign of bullishness. Additionally, the moving average (MA) value is at 6.56, indicating no major change in the price trend.

The relative strength index (RSI) is currently at 43.44 which indicates an overbought situation and thus traders should be careful of a potential short-term reversal. The MACD indicator has given a positive crossover as the coin gave a breakout of the supply zone and pushed higher toward the resistance level of $6.64. The histogram on the MACD indicator is greenish in color and is moving upwards, which means that the buying pressure is strong in the near term.
Uniswap price analysis conclusion
To sum up, Uniswap price analysis is currently bullish in the short-term and long-term outlooks. The coin has been trading in an uptrend since the start of today’s trading session, and buyers are expected to keep pushing the price higher if they continue to enter the market.


