Uniswap price analysis shows that the UNI/USD pair has gained tremendous value in the recent past and is currently trading at $6.56. The price action is likely to continue in the near future as the support present at $6.28 is very strong. However, the price may face some resistance at $6.69. Overall, the bias is bullish for the near future. The bearish was in control yesterday, however, the bulls have gained control and pushed the price back upwards.
The cryptocurrency market has been seeing a lot of positive momentum in the last hours, with most major assets seeing significant gains, the price for the coin has increased by nearly 4.45 percent in this time. The market capitalization for the coin stands at $4.99 billion, while its trading volume over the past 24 hours has been $177 million.
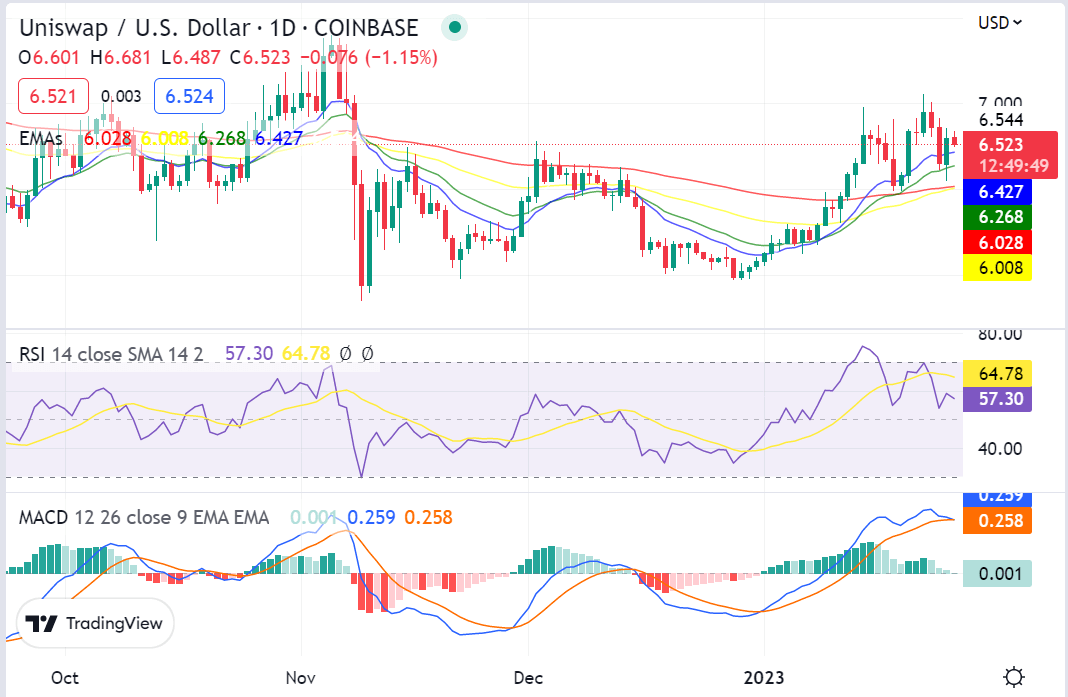
Uniswap price analysis 1-day price chart: UNI trades at $6.54 after a bullish run
Looking at the daily chart for 1 day, it is clear that the Uniswap price analysis has been on a constant uptrend. The bullish momentum gathered strength as the price rose from $6.28 to test the resistance of $6.69, and currently trading at $6.54 levels. The next aim for the cryptocurrency market is to break the $7.00 level, however, for that to happen, the bulls need to put in some more effort and gain more momentum.

The technical indicators also suggest a bullish trend as the MACD has crossed over into the buy zone showing increasing buying pressure. The RSI is inching toward the overbought territory but is still in the bullish trend. The current pattern suggests that the price has been forming a Cup and Handle formation which may lead to a breakout if it continues with its upward momentum. The 9-EMA and the 21-EMA are also indicating a bullish trend. The 9-EMA is currently at $6.52, while the 21-EMA is at $6.47.
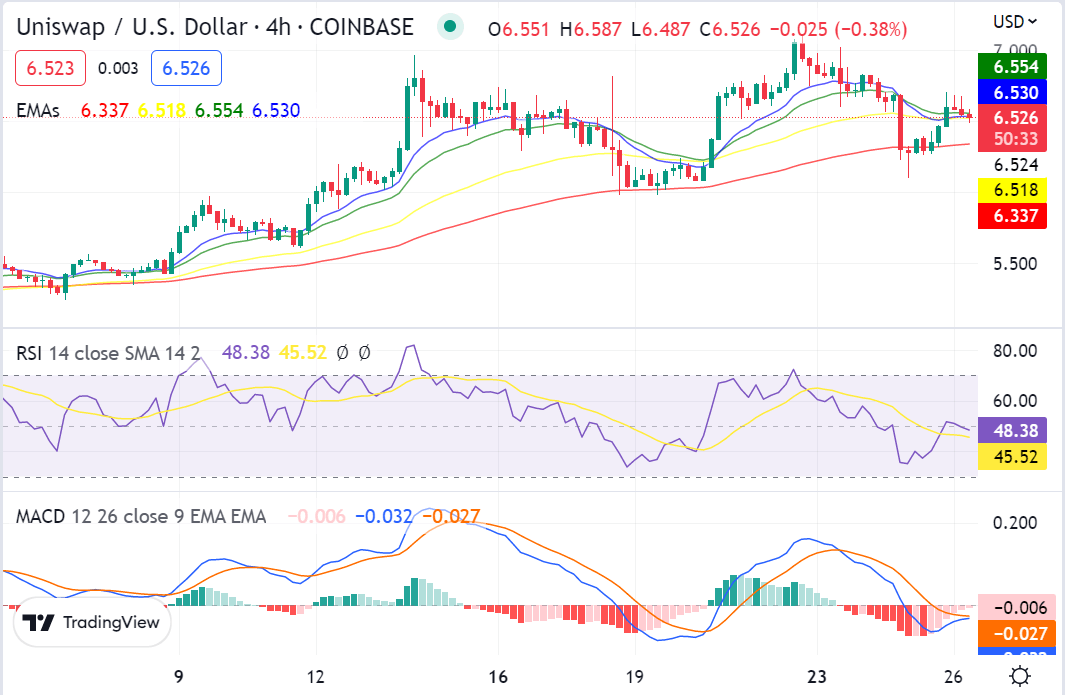
Uniswap price analysis 4-hour chart: Bulls continue to dominate the market
Looking at the 4-hour Uniswap price analysis chart, it is clear that the bulls are still very much in control as they continue to push the price upwards. The buying pressure is still present and the price is currently trading at the $6.56 level. Due to yesterday’s bearish run, the price went down to $6.28, however, the bulls have managed to recover and push it back up.

The MACD has crossed into the buy zone and is now indicating a strong bullish trend. The MACD line is currently at 0.023 and is above the signal line, which further indicates a bullish trend. The Relative Strength Index (RSI) is also in the overbought territory, currently at 45.52 and indicating a strong bullish trend. The exponential moving averages are also indicating a bullish trend as the 9-EMA is at $6.55 and the 21-EMA is at $6.50 levels.
Uniswap price analysis conclusion
Overall, the Uniswap price analysis suggests that UNI is likely to maintain its current uptrend in the near future, as more investors enter the market and increase buying pressure. The resistance at $6.69 may prove to be a challenge for the bulls, however, if they are able to break it, then we could see UNI reaching new heights in the near future.


