According to our weekly crypto price analysis, the cryptocurrency market is taking a much-needed breather, as the bulls have retreated. According to our weekly crypto price analysis for 26th November, the crypto market seems to be trading in a consolidation phase. Bitcoin is holding above $16,000, but still, it has not shown any sign of a breakout.
After jumping to one-month highs, BTC price action, as well as that of major altcoins, has reversed downwards. Amid the current market sentiment, Hong Kong’s first bitcoin and ether futures exchange-traded funds (ETFs) ended their first trading day higher on Friday, reflecting investors’ interest despite the broader crypto market meltdown.
This time around, however, there is plenty for crypto investors to worry about — beyond macro, the FTX saga rolls on, with concerns around Binance also lingering. The DeFi sector has also been hit hard by the market downturn, and many projects have seen their tokens lose value.
Weekly crypto price analysis: Bears mount pressure on cryptocurrencies
Ethereum also saw a decline to its support level at $1,100.42 after reaching a weekly high of $1,344. XRP continues to struggle as it falls to $0.3499 after briefly touching $0.4062 last week. ADA and DOGE also saw declines, with ADA falling to $0.0.2635 and DOGE dropping to $0.07724.
Looking at the Cryptocurrency price heat map, Most of the altcoin markets are experiencing declines, with only a few gaining ground in the red sea like the MATIC and CRO markets. The overall market cap for cryptocurrency seems that the market is experiencing a correction after recent bullish movements. It will be important to keep an eye on key support and resistance levels in the coming days to see if the market can bounce back or if it will continue to retrace.
BTC/USD
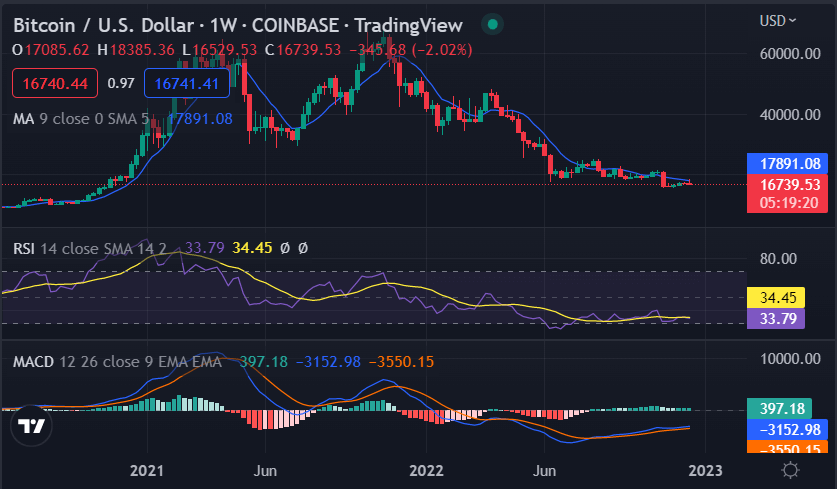
Bitcoin’s performance in the last week has been characterized by massive price fluctuations and volatility, with the price reaching the $18K level. However, the recent bear rally has caused BTC to fall from last week’s highs and is trading at around $16,687.12, down by 2.87 in the last 7 days. It will be important to watch if this level holds as support or if it breaks and we see further decline. The BTC/USD has decreased by -.25% within the past 24 hours.

The weekly crypto price analysis shows that the technical indicators are currently giving mixed signals as the MACD shows bearish momentum while the RSI is at a neutral level. As for the moving averages, they are still showing bearish movement at $16,772.25.
ETH/USD
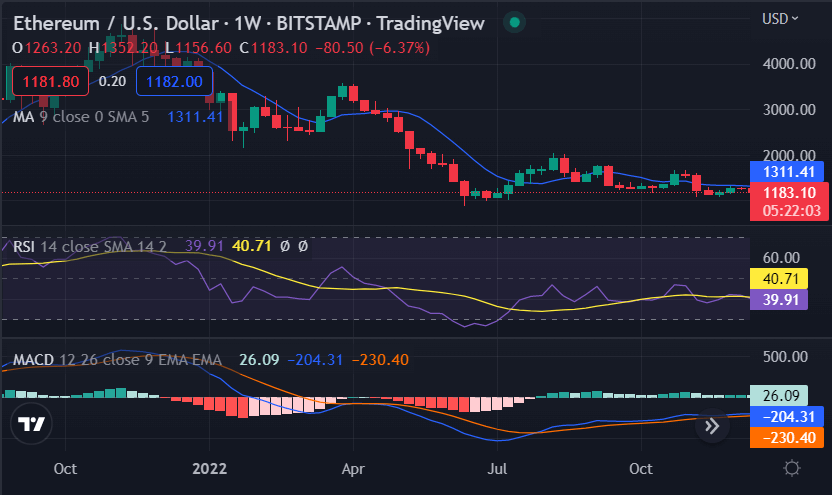
Ethereum coin has also seen strong movements over the last week as it reached a high of $1,34. However, like Bitcoin, we are seeing some correction in the market and ETH is currently trading at $1,177.90, with a support level of $1,100.42, and if the bearish trend continues the price could potentially drop to $1,000. The resistance level to watch for is $1330.59.

The technical indicators show a bearish momentum with the MACD and RSI both pointing downwards. As for the moving averages, they are still showing bearish movement at $1189.60.
XRP/USD
XRP has seen a slight decline over the last 24 hours as it drops to $0.35 after strong movements last week that saw it reach a high of $04462. The Ripple price analysis has made high important to watch the support level at $0.34, while the resistance level to watch for is $03924, and a move above this level could indicate bullish momentum for XRP.

The Relative Strength Index (RSI) and Moving Average Convergence Divergence (MACD) are both showing bearish momentum, while the moving averages are still pointing downwards at $0.35.
DOGE/USD
Dogecoin rebounded off the support at $0.07 on Dec. 14, indicating that the bulls are trying to establish a higher low at this level. According to our weekly crypto price analysis, the altcoin could be expected to range between $0.07 and $0.10 in the near term as long as BTC’s momentum does not improve significantly.
Dogecoin is trading at $0.07744, down by 20.10 percent in the last 7 days. The technical indicators are showing a weak bearish momentum with the MACD and RSI both pointing downwards. As for the moving averages, they are still showing bearish movement at $0.07744.
BNB/USD
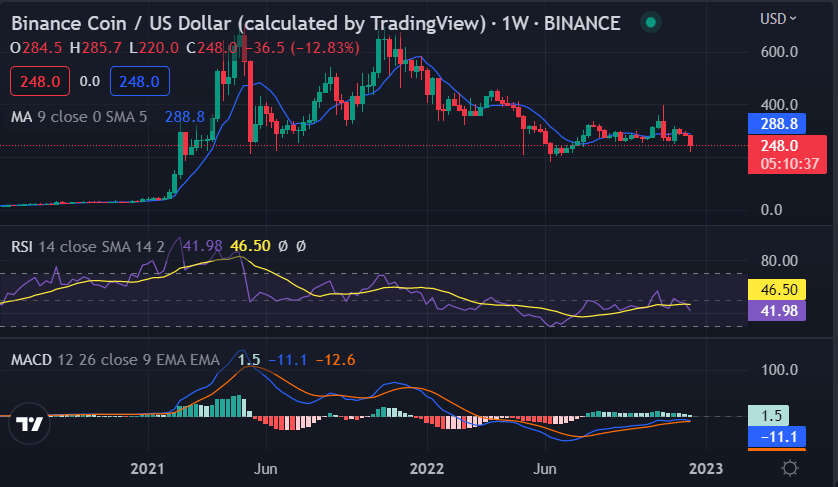
Binance coin price action shows a descending trendline after hitting a high of $314.1 on Nov 27th. It is currently trading at $237.40, after declining by over 17% in the last 7 days.

The weekly technical indicators show that BNB has been experiencing a bearish momentum with the MACD and RSI both pointing downwards. As for the moving averages, they are still showing bearish movement at $237.40. BNB rebounded off the 50 MA during the weekend but was unable to break above the 200 MA, showing bearish movement. The MACD also shows bearish momentum as the signal line crossed below the MACD line.
ADA/USD
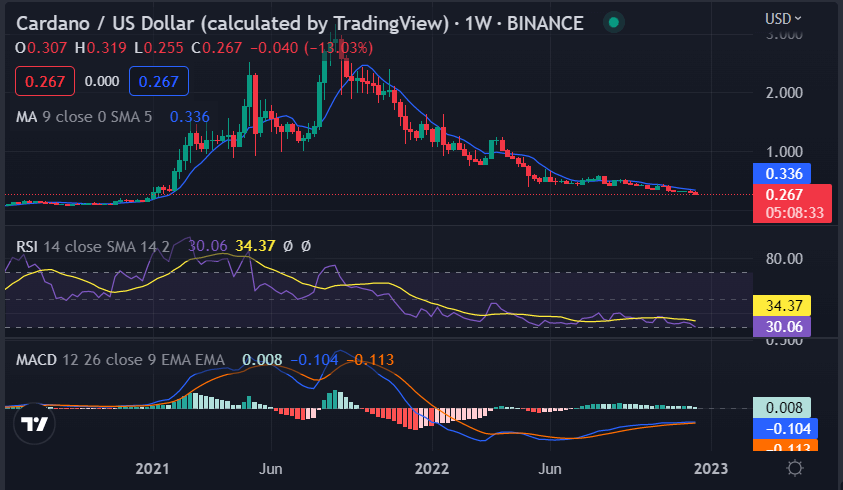
Cardano is exhibiting a bearish trendline that is cutting through the 200 MA. The altcoin is currently trading at $0.07869, down by 10.18% in the last 7 days. After a two-day relief rally, the selling resumed yesterday, and the bears pulled the price to the support line of the wedge.

According to the weekly crypto price analysis, ADA has been ranging between $0.07 and $0.09 for the past week and could be expected to continue trading within this range in the near term. The sharp selling pressure has pushed the MACD into bearish territory and the RSI is also trending downwards at 34.37. The moving averages show bearish momentum as well, with the 50-day MA crossing below the 200-day MA. The important levels to watch for ADA/USD are $0.399 as support and $0.4259 as resistance.
Weekly Crypto Price Analysis Conclusion
Overall our Weekly Crypto Price Analysis indicates that the market is currently showing bearish sentiment, with some altcoin coins experiencing bullish momentum while others are facing bearish pressure. The market might break out of this trend this week, but it is important for traders to keep an eye on key support and resistance levels for each coin.


