Our weekly crypto price analysis covers the trending cryptocurrencies; Bitcoin, Ethereum, Cardano, Polkadot, Ripple, and Binance coin BNB. The cryptocurrency markets corrected as the United States’ 10-year Treasury yield increased to its highest level since 2008. The U.S. stock markets recovered ground after the Wall Street Journal reported that some Federal Reserve officials were concerned about the pace of the rate hikes and the risks of over-tightening, even though this type of rally is often bad for risky assets.
Market leaders Bitcoin and Ethereum are currently trading in a consolidation phase, with the latter managing to reclaim some lost ground. Meanwhile, Bitcoin climbed to the $19,100 level, but a minor pullback was seen during the weekend after a short-lived selling pressure. Ethereum also reached a weekly peak of $1,340 but has pulled back to $1,304.11, where it is currently trading.
Looking at the cryptocurrency prices heatmap, most of the altcoins are trading in the green, and the worst performers of the day are Chiliz and eCash XEC, which have declined by 12.17% and 6.23%, respectively. Ripple and Stellar are the top gainers of the week among the altcoins, gaining by over 6%. Upon the closure of the week, sharp retracements towards the downside are on play across the market, resulting in a significant medium-term retracement, after which we will see markets likely push lower over the following weeks in case the prices fail to rebound.
Weekly Crypto Price Analysis: Bullish trend cuts across the entire crypto market, will it hold in the coming week?
Looking at our weekly crypto price analysis, most of the cryptocurrencies are trading around the near-support levels and close to resistance levels. A breakout in any direction is likely as most of the cryptocurrencies have not made significant price changes to set a clear market trend. The majority of the cryptocurrencies are expected to continue following their respective price trends in the near term. However, some corrections cannot be ruled out as the market is highly overbought at the moment, and prices might witness a minor pullback in the near term.
In the coming week, most of the cryptocurrencies are likely to continue with the bullish sentiment if the market sentiment remains favorable.
BTC/USD
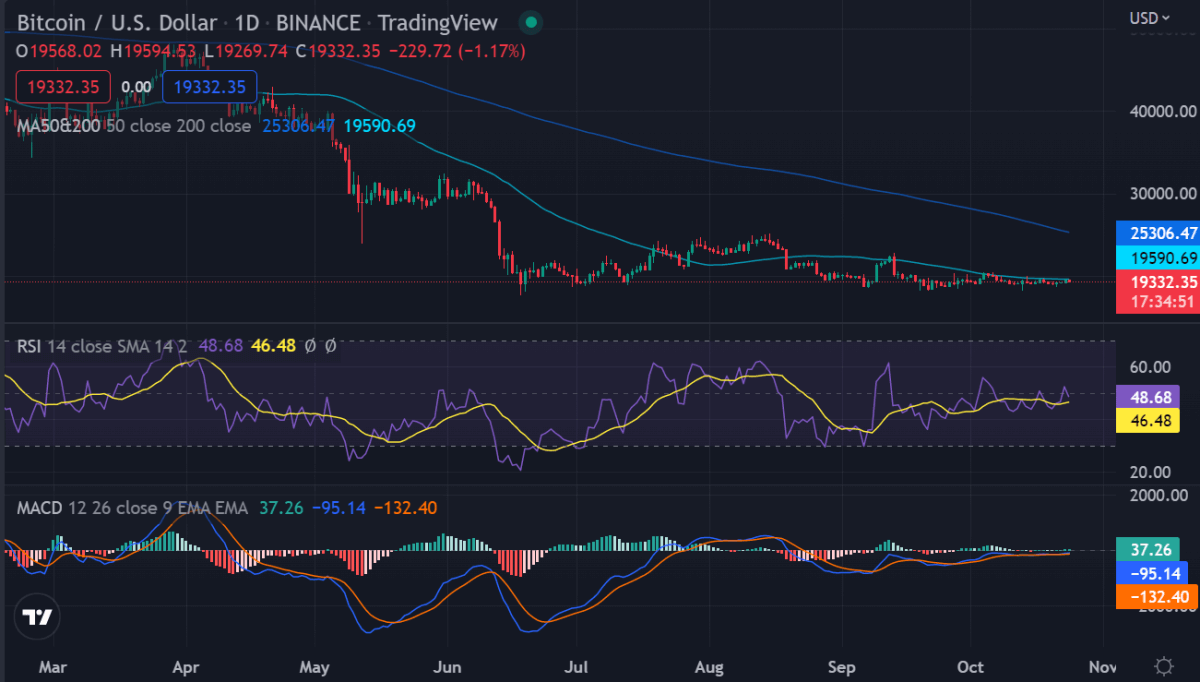
BTC/USD fell below $19,000 sharply after hitting the week’s high and has been fluctuating around the $18,900 to 19,100 level in the last few days. The current market structure is neutral, and a further decline toward $18,800 cannot be ruled out in the near term.
Bitcoin’s relief rally is facing strong resistance in the zone between the 50-day simple moving average (SMA) ($20,019) and the downtrend line. This shows that bears are selling on rallies and will try to pull the price to $18,626.
The repeated retest of a support level tends to weaken it. If bears sink the price below the strong support at $18,850, the BTC/USDT pair may witness panic selling. That could open the doors for a possible retest of the June low at $17,622.
If the price slips and sustains below $18,843, the BTC/USDT pair could drop to $18,125. The bulls are expected to defend the zone between $18,125 and $17,622 vigorously because if they fail to do that, the pair could resume its downtrend. The next stop on the downside could be $15,750.
BTC/USD entered a bullish sentiment during yesterday’s closure of the market, and the bulls have held above $19,187.88 for the last 4 hours. To invalidate this bearish view, the bulls will have to push and sustain the price above the downtrend line. If that happens, the bullish momentum could pick up, and the pair could rally to $22,799. The bears may pose a strong challenge at this level.
The long tail on the Oct. 22 candlestick shows that buyers purchased the dip below $18,843. They will try to propel the price above the moving averages. A break above the 50-day SMA ($19,616) could clear the path for a possible rally to $20,500. This is an important level to keep an eye on because a break above it could signal the start of a strong recovery to $22,800 and then $25,211.
ETH/USD
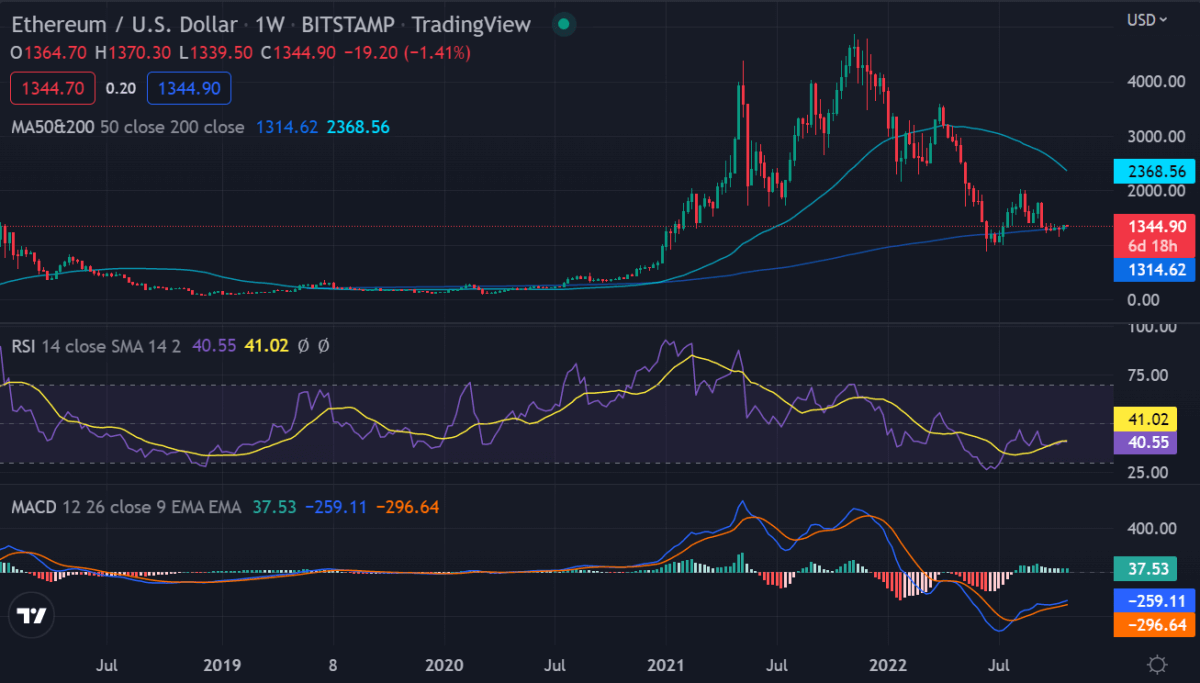
Ethereum climbed above $1,335 on 18/10/2022, and the bulls have been able to hold above $1,309.96 in the last 24 hours. Ethereum is struggling to rise above the 20-day EMA ($1,313), but a minor positive is that the bulls have not allowed the price to sustain below the immediate support at $1,263.
If the price turns up from the current level and breaks above the 20-day EMA, the ETH/USDT pair could rally to the downtrend line of the descending channel. Buyers will have to thrust the price above this resistance to indicate the start of a new up-move.
On the contrary, if the price continues lower and breaks below the $1,220 to $1,190 support zone, the selling could intensify, and the pair could drop to the psychological level at $1,000 and then to the support line of the channel.
ETH is up by 0.73 percent after a slight bear-and-bull battle. The bulls have been struggling to push the prices above the key resistance level of $1,317.10.
XRP/USD
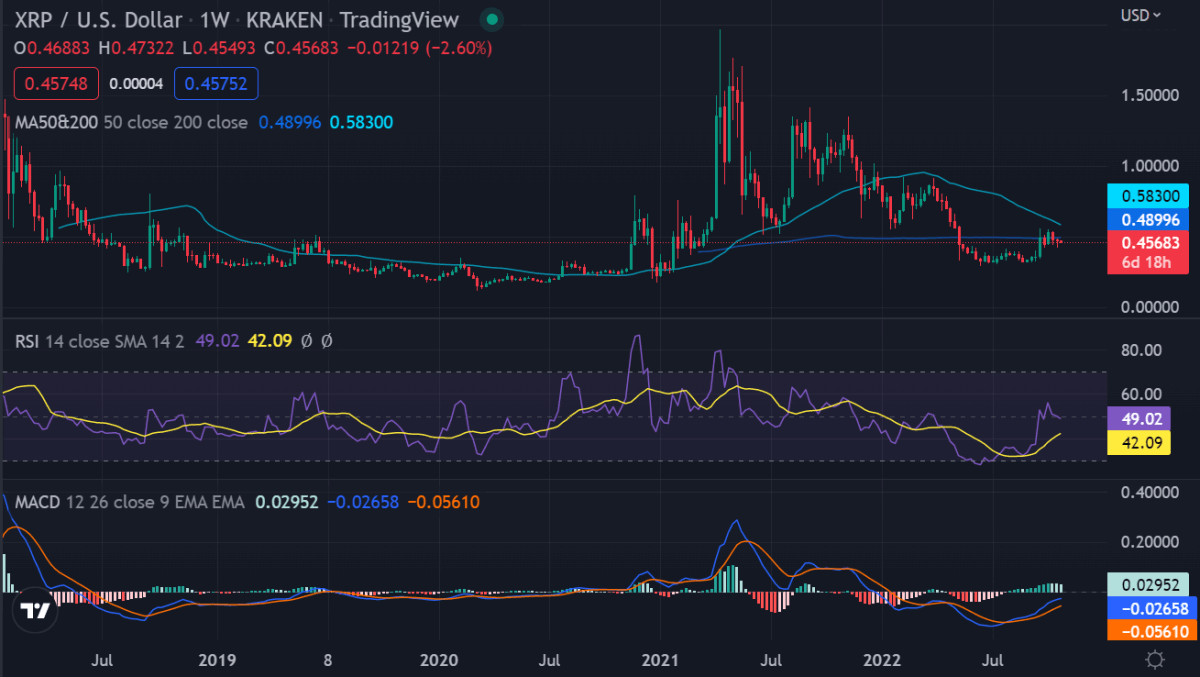
Our weekly crypto price analysis for ripple indicates a slight retracement from the recent price slump of around $. The swing lows formed saw XRP fall to weekly lows of around $0.466, which is currently acting as the major support level of the current price. Ripple is currently trading at $0.4587 after retracement from the recent lows. Ripple plunged below the developing symmetrical triangle pattern on Oct. 20, but the long tail on the candlestick shows that the bulls are buying the dips to the 50-day SMA ($0.43). Buyers again defended the 50-day SMA on Oct. 21.
The 20-day EMA ($0.46) has started to turn down, and the RSI has slipped into negative territory, indicating that the bears have a slight edge. If the price turns down from the current or 20-day EMA level, the bears will try to pull the XRP/USDT pair to the breakout level of $0.41. This level is likely to attract strong buying.
On the upside, a break and close above the 20-day EMA will be the first indication of strength. The pair could then rise to $0.51 and later to the resistance line. A break and close above the triangle could improve the prospects of the resumption of the uptrend.
At the moment, the bulls are defending the key $0.50 support area, and they are likely to make another attempt to push prices above the $0.455 resistance area. If they succeed, there could be a sharp increase in buying pressure, and prices might even reclaim the $0.5500 level. The main support is now near the $0.440 level, below which ripple‘s price could extend losses towards the last swing low of $0.4013.
ADA/USD
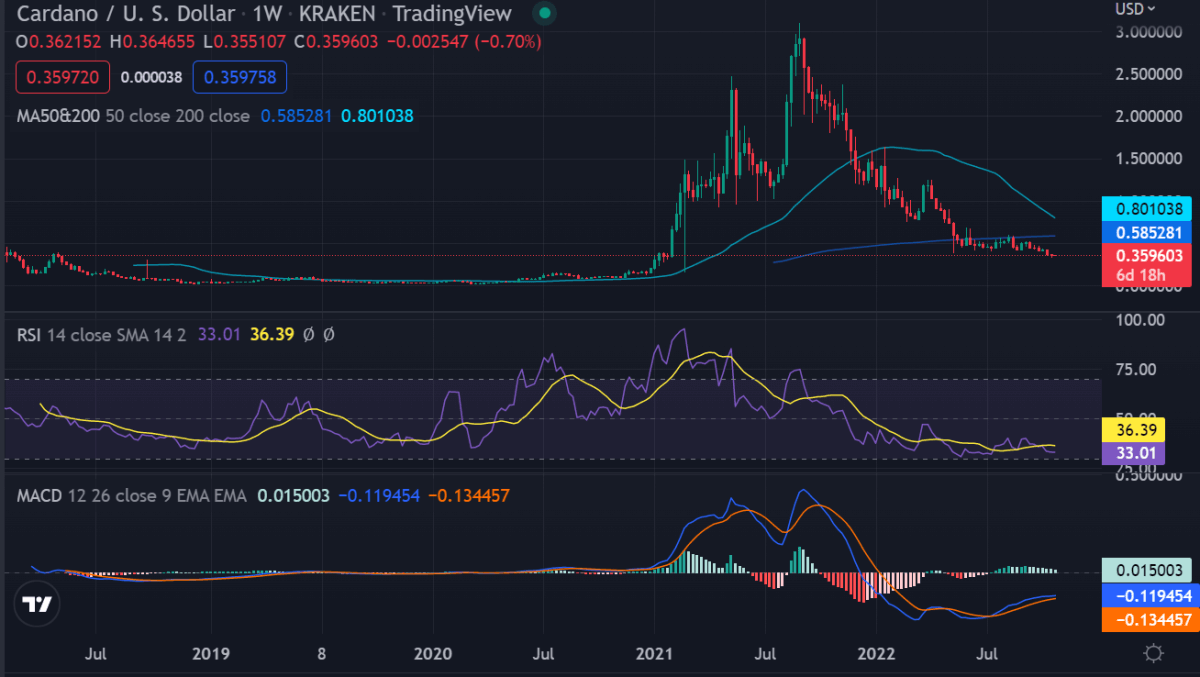
According to our weekly crypto price analysis, Cardano followed a downward trendline before the bulls came in on 21/10/2022 to push the prices to the current $0.3493.After a two-day relief rally, the selling resumed on October 18, and the bears pulled the price to the support line of the wedge.
The sharp selling of the past few days has sent the RSI tumbling deep into the oversold territory. This suggests that the selling may have been overdone in the near term, and a relief rally or consolidation may be around the corner.
If the price rebounds off the support line, the ADA/USDT pair will attempt to rise to $0.36 and then to the 20-day EMA ($0.38). A break above this level will be the first indication that the bears may be losing their grip.
On the downside, if the price breaks below the support line, the selling could further pick up momentum, and the pair could plummet to $0.30.
The price has again tumbled below the uptrend line on Sept. 30. The downsloping moving averages and the RSI in the negative territory suggest that the path of least resistance is to the downside. If the price breaks below $0.42, the ADA/USDT pair could decline to the crucial support at $0.40. The bulls are expected to defend this level with vigor.
SOL/USD
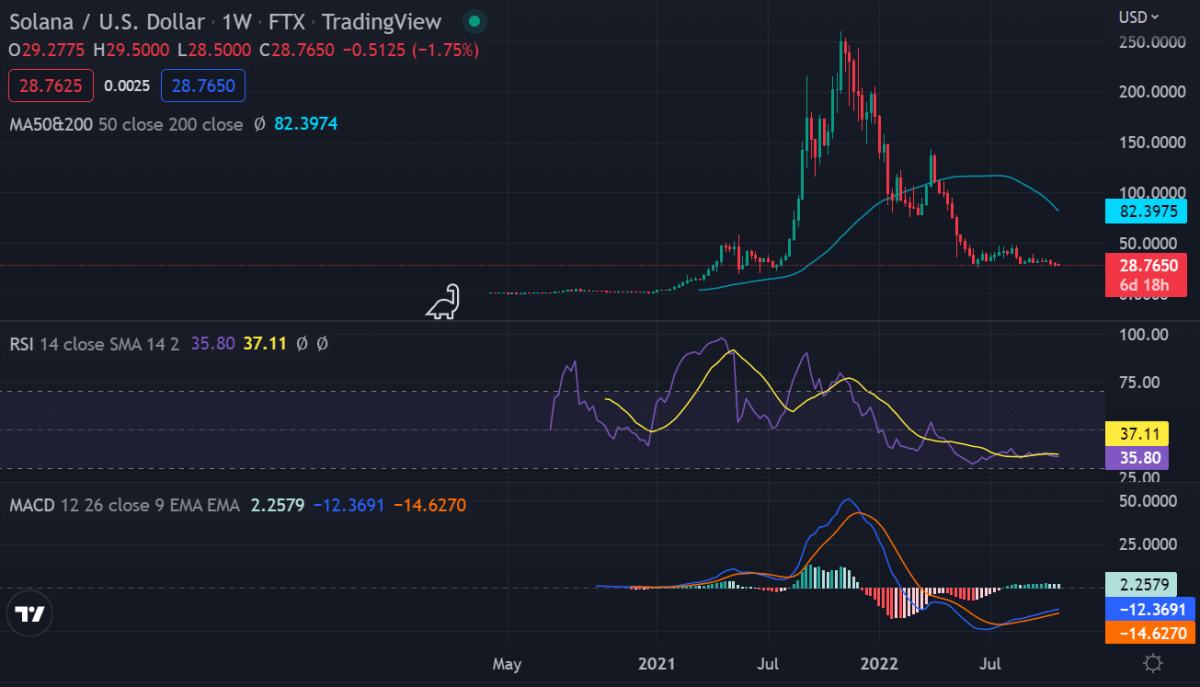
Our weekly crypto price analysis indicates Solana cryptocurrency has been progressing well in the last week, moving from a low of around $27.73 to a recent high of around 28.48. Solana .dropped below the $29.42 support on Oct. 19, indicating increased selling pressure from the bears. The selling continued, and the $27.87 support was taken out on Oct. 21. This clears the path for a retest of the crucial support at $26.
The downsloping moving averages and the RSI in the negative territory indicate that bears are in control. If the SOL/USDT pair does not rebound sharply off $26, the possibility of a break below it increases. The pair could then decline to the next support at $22.
Contrary to this assumption, if the price turns up from the current level or $26 and breaks above $30, it will signal accumulation at lower levels. The bullish momentum could pick up in the near term after the pair breaks above the 50-day SMA ($32.28).
The 20-day EMA ($33.30) is trying to turn up, and the RSI is just above the midpoint, suggesting that the bulls are attempting a comeback. If the price breaks and sustains above the 50-day SMA, the bullish momentum could pick up, and the SOL/USDT pair could rally to $39. The bears are expected to mount a strong resistance at this level.
Alternatively, if the price turns down from the 50-day SMA, the pair could drop to $31.65. A break below this support could sink the pair to $30.
Weekly crypto price analysis conclusion
Overall our weekly crypto price analysis indicates that we will see consolidation in the week before an uptrend is set in the week. As several higher highs and lows have been established across the major altcoins, the crypto price action is still bearish.


