Weekly crypto price analysis reveals that most of the cryptocurrencies have been tumbling over the last few days, with bearish sentiment dominating the market. The selling pressure on the crypto markets has been increasing, leading to a decline in prices. The Bitcoin price pulled back from a high of almost $31,000 and it has been hovering below $30,000 since then. The coin is expected to remain in a range-bound mode for some time before making a decisive move either way.
The Ethereum price has been following the same pattern as Bitcoin, with a slight downward trend. It is currently trading at around $1,800 after having peaked at over $2,000 recently. Ethereum is expected to remain volatile in the near future and any major moves are unlikely in the short term.
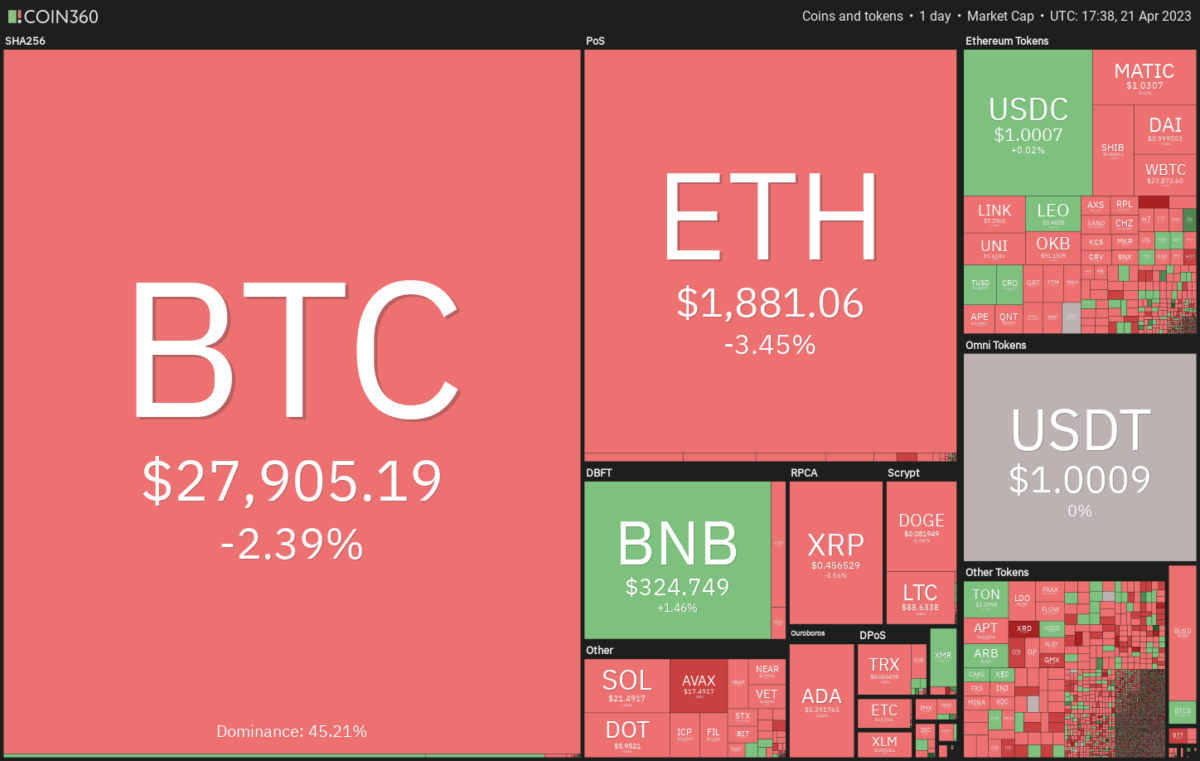
The majority of altcoins are trading below the support levels, unable to break through any significant resistance point. Some of the top performers include Uniswap (UNI), Binance Coin (BNB), Cardano (ADA), Polkadot (DOT), and Aave (AAVE). Overall, the crypto markets have been bearish this week, with most of the coins losing value.
BTC/USD
The Bitcoin price has been trading within a tight range of $30K and below since last week. The bearish has been ruling in the crypto markets and Bitcoin has not been able to break through any significant resistance points. Currently, BTC is currently trading at around $27,905, down more than 8.70 per cent for the last 7 days.
The previous week, the BTC hit a high of $31k but the buying failed to keep up and it crashed back down. The next major support level for Bitcoin is at $26k, while any rise above $30k will be seen as a bullish signal. The volume has been decreasing week-over-week and the bearish pressure is likely to continue as we head into the new year.

BTC fell below the 20-EMA and the-EMA, indicating a strong bearish trend. The 50-EMA is also below the 200-EMA and there is significant downward pressure. The MACD indicator has been indicating bearish divergence, with the MACD line remaining below the signal line. The Relative Strength Index (RSI) is also has been trending down and currently trading at around 59.46.
ETH/USD
The Ethereum price has been trading within a tight range of $1,900 and below since last week. The bearish pressure is still reigning in the crypto markets and Ethereum has not been able to break above any major resistance points. The Bearish pressure on ETH is expected to continue for some time before any major moves are made. At the time of writing, the ETH price is currently trading at around $1,881, with a loss of more than 11 per cent for the past 7 days.

Looking at the weekly chart, ETH has fallen below the 20-EMA and the 50-EMA, indicating a strong bearish trend. The moving average indicator has been under bearish pressure for the past week and is expected to remain so for some time. The MACD indicator has been indicating bearish divergence, with the MACD line remaining below the signal line. The Relative Strength Index (RSI) is also trending below 70, which is another sign of bearishness.
ADA/USD
According to the weekly price analysis, Cardano (ADA) has been trading within a range of $0.381-0.451 for the past week, with a light downward trend. The coin had briefly crossed above $0.45, only to see it slipping back down again due to strong bearish pressure from the markets. At the time of writing, ADA is currently trading at around $0.3942 with the support of the coin being quite weak.

The ADA/USD has lost more than 12 per cent in the past seven days and is currently trading below the 20-EMA and the 50-EMA, both of which are trending downwards. The MACD indicator has been indicating bearish divergence for some time now, with the MACD line remaining below the signal line. The Relative Strength Index (RSI) is also has been trending down and currently trading at around 49.61. This indicates that the coin is in a bearish trend for some time now, with no signs of any bullish rally in the near future. The 50-week MA is also below the 200-week MA, further confirming the bearish trend.
SOL/USD
The bearish pressure has been quite prominent in the crypto markets and Solana (SOL) is no exception. The coin’s price had previously crossed $25 but could not sustain it and came tumbling down again due to strong bearish pressure from the markets. The bullish momentum that had been built up a few weeks ago has now fizzled out, and the coin is currently trading at around $22.11, with a loss of more than 8.55 per cent for the past 7 days.

If bullish momentum is to be achieved, SOL must break the current resistance level at $22.50 and then continue its upward trajectory from there. Currently, The Solana price is below both the 20-EMA and the 50-EMA, indicating a strong bearish trend. The moving average indicator has been under bearish pressure for the past week and is expected to remain so for some time. The MACD indicator has been indicating bearish divergence, with the MACD line remaining below the signal line. The Relative Strength Index (RSI) is also trending below 50, which is another sign of bearishness.
DOGE/USD
Dogecoin (DOGE) has been trading within a tight range of $0.09343-0.0777 for the past week, with a slight downward pressure from the bearish trend in the markets. However, the bulls were seen fighting back, and the coin managed to sustain its gains for some time.
Dogecoin price analysis is currently standing at around $0.08024, with the support level seen at $0.07888 and resistance at $0.08092. The coin has lost more than 11 per cent in the past 7 days and if bearish pressure continues, the price may drop further. However, the buying sentiment could pick up if the coin manages to break through the current resistance and continue its upward trajectory.

The weekly technical analysis shows the DOGE/USD has been below the 20-EMA and the 50-EMA, indicating a strong bearish trend. The MACD indicator has been hovering around the zero line, with no major sign of any bullish divergence. The Relative Strength Index (RSI) is also trending below 50, suggesting that the coin could remain bearish for some time. The 50-weekly MA is also below the 200-weekly MA, confirming the bearish outlook for Dogecoin in the near future.
XRP/USD
The XRP/USD has been in bearish territory for some time now and has lost more than 9.79 per cent in the past seven days. The coin had previously breached the $0.534 mark but was unable to sustain it due to strong bearish pressure from the markets. The selling sentiment is strong, with the coin currently trading at around $0.4676.

The moving average indicator has been indicating a strong bearish trend, with both the 20-MA and the 50-MA trending downwards. The moving average converge divergence (MACD) indicator has been hovering around the zero line, with no major sign of any bullish divergence. The Relative Strength Index (RSI) is also trending below 60, further suggesting that the coin could remain bearish for some time.
Weekly Crypto Analysis Conclusion
Overall, the crypto markets have been in a bearish trend for the past few weeks and this is likely to continue in the short term. The strong bearish pressure has meant that all major coins such as Bitcoin, Ethereum, Ripple, and Dogecoin have seen heavy losses over the past few days. The buying pressure has been weak, however, there is potential for the market to be impacted by some positive news which could result in a bullish breakout.