Weekly crypto price analysis for 15th September 2023 reveals that most of the cryptocurrencies have been trading in mixed signals, with bullish and bearish trends visible in individual crypto coins. The top coins like Bitcoin, Ethereum, and XRP have been the most volatile in the past few days, with selling and buying activities occurring in a wide range.
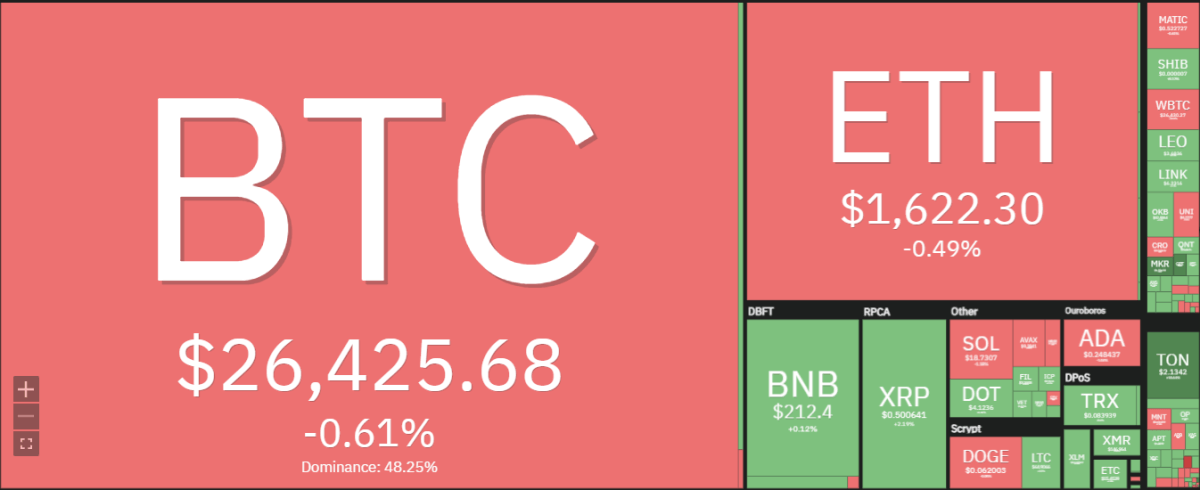
The BTC price rallied above $26k in the past few days, following August’s higher-than-expected CPI figures. The previous week, the BTC was hovering below the $26k level with bearish patterns; however, the recent bullish trend has taken over.
Ethereum is trading around $1,600 levels, with a sideways movement, and there is no clear indication of a breakout or breakdown yet. The Bears and Bulls have been struggling for dominance in the past week, and ETH has struggled to make a decisive move.
The Ripple (XRP) price analysis has struggled to keep above 0.46 USD, but it appears to stabilize. Over the past week, BNB price analysis has been mainly bullish with some adjustments. BNB has been trading in range-bound movements between $204 and $215, indicating a tight trading range. Cardano (ADA) has been trading with a slight bias on the selling side. ADA has maintained its bearish posture in the past few days
Dogecoin (DOGE) has also been trading sideways over the past week, with occasional minor price fluctuations. Solana broke below its resistance level of $20 and is currently trading around the $18.70 mark.
BTC/USD
Weekly crypto analysis reveals the BTC/USD pair has been trading in a mildly bullish trend over the past week, with minor corrections occurring here and there. The price is currently trading near $26,000 levels after retesting the $25k support level and is likely to go higher in the coming weeks. At the time of writing, BTC is currently trading at $26,425, with a 24-hour decrease of 0.49%; however, over the past seven-day period, it has gained 2.02%.

The 20-EMA and 50-EMA lines point upwards, indicating a bullish trend. The moving average convergence divergence (MACD) indicator has been increasing and staying in the positive territory. This is a strong bullish signal for BTC in the coming days. The strong resistance level, at $26.500, is expected to hold prices in check until a strong bullish sentiment is seen. However, if the bulls manage to break above the $27k level, BTC could surge higher. The RSI indicator has been hovering around 50 levels, indicating that the coin is in a range-bound movement.
ETH/USD
The ETH/USD pair has been trading in a volatile sideways pattern over the past week, with bulls and bears struggling for dominance. The price is currently trading near the $1,600 level after bouncing off from its support level of $1,540. The bearish pressure has been holding Ethereum in check, and it is unclear if the bulls can break through. At the time of writing, ETH/USD is currently trading at $1,622, with a 24-hour decrease of 0.49% and a 7-day 0.79% decrease.

Most of the technical indicators in the past week have been indicating neutral signals. The 50-EMA and 20-EMA lines have been moving in tandem, indicating that the market is not yet ready for a big move one way or another. The MACD indicator has been hovering in neutral territory, indicating that the coin is in a range-bound movement for now. The RSI indicator has been steadily hovering below 50 levels, suggesting that ETH/USD prices could remain stable or move in the coming days.
BNB/USD
The BNB price analysis reveals that the coin has been trading at $204-$215 for most of the week, with bulls and bears equally active in the market. At the time of writing, BNB is at $212, up by 0.12% in the last 24 hours. The strong support is $204, while the resistance is $215. If bears manage to break below the $204 support level, it could signal a bearish trend for BNB; however, if the resistance level of $215 is breached, BNB could surge higher.

The technical indicators have been pointing to an impending breakout in either direction, but it’s unclear whether it will be the bulls or the bears who take charge. The 50-EMA and 20-EMA lines point downwards, indicating that bears have been in control. The MACD indicator has slowly moved into negative territory, indicating a bearish trend. The Relative strength index (RSI) is currently hovering around the 33 level, indicating that the coin is in a range-bound pattern.
XRP/USD
According to the weekly crypto price analysis, the XRP has been trading between $0.4600 and $0.500 for most of the week, with sideways movement. The bearish pressure has risen, with the coin failing to break above 0.5100 levels. The token has decreased by 0.62 percent in the past seven days and is currently trading at $0.5011 as of this writing.
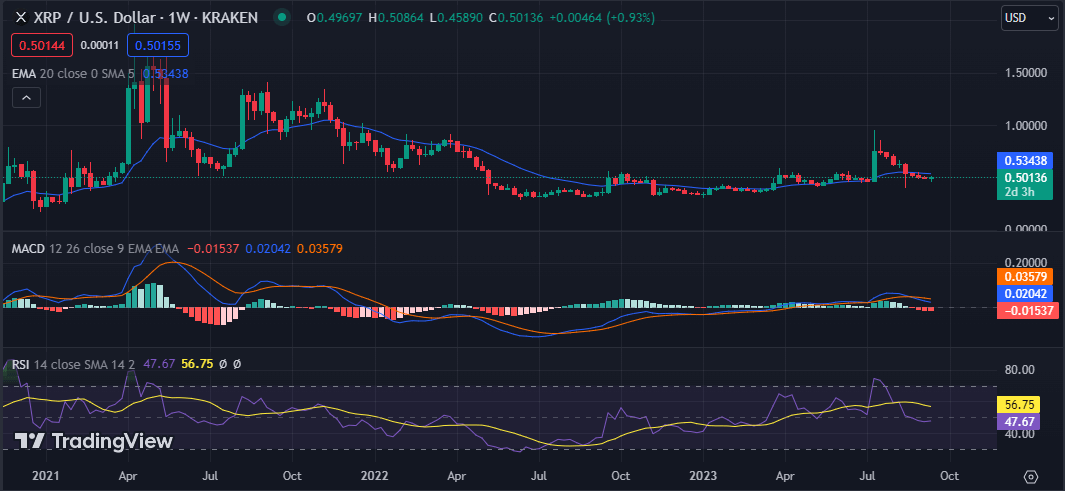
The 20-EMA has a slight downward angle, indicating that the bearish trend will likely continue soon. The moving average convergence/divergence (MACD) shows bearish momentum, with a slight divergence from the signal line. The relative strength index (RSI) is below 50, indicating that selling pressure may remain strong in the coming days. A break below $0.4600 could cause the prices to move further lower; however, a move above $0.500 could push the prices higher.
ADA/USD
According to the recent crypto price analysis, ADA has been trading between $0.2300 and $0.2500 over the past week, with bulls and bears struggling for dominance. The selling pressure has been dominating the market, with bears in control. The price is currently trading at $0.248 as of this writing, with a 24-hour decrease of 0.62% and a 7-day decrease of 1.65%.

The 20-EMA line has been pointing downwards, indicating that bearish pressure will likely continue for ADA/USD in the near future. The MACD indicator has steadily decreased, indicating a bearish trend for ADA. The RSI indicator is currently hovering near 35 levels, which suggests that selling pressure could remain strong in the coming days. Most moving averages also point to a bearish trend for ADA in the near future.
DOGE/USD
The weekly crypto analysis reveals that Dogecoin has been trading in a sideways pattern over the past week, with occasional minor price fluctuations. DOGE/USD touched a weekly low of $0.05957 and is currently trading around the $0.06220 mark as of this writing. The bulls have been struggling to break out above the resistance level of 0.06300, with bears in control since then.

The weekly technical analysis reveals that most of the indicators are in the neutral zone at the moment, with no clear directions for the price. The relative strength index (RSI) is currently at 41.14, indicating a neutral market sentiment. The MACD line has crossed up below the signal line. However, it is still trending downwards.
SOL/USD
Weekly crypto analysis shows that Solana has been trading in a range-bound pattern over the past week, with bulls and bears equally active in the market. The support level at $17.00 is holding strong for now, while the resistance stands at $20.00. Bears have controlled the market over the past few days and kept SOL/USD prices below $20.00. As of this writing, Solana is trading at $18.70, down by 0.91% in the last 24 hours and 3.93% in the past 7 days.

Most of the technical indicators indicate neutral signals for SOL/USD in the upcoming days. The moving averages have been slowly trending downwards, indicating that bears control the market. The MACD indicator has steadily decreased, indicating a bearish trend for SOL/USD. The RSI indicator is currently near 45 levels, suggesting the coin is in a range-bound movement.
Weekly Crypto Analysis Conclusion
The weekly technical analysis reveals that most of the indicators are in the neutral zone at the moment, with no clear directions for the price. The relative strength index (RSI) is currently at 41.02, indicating a neutral market sentiment. The MACD line has crossed up below the signal line. However, it is still trending downwards.