July is here, and everyone in the crypto community is anxiously watching Bitcoin. This month is set to bring some major changes, and not necessarily the kind we all hope for.
One of the biggest events casting a shadow over Bitcoin’s near future is the impending Mt. Gox repayments. Once the largest Bitcoin exchange, Mt. Gox collapsed in 2014 after a massive hack.

Now, after a decade, the creditors are finally set to receive their long-awaited repayment of 140,000 BTC, worth around $9 billion.
The Mt. Gox repayment plan has been looming over the market like a dark cloud. Starting in early July 2024, creditors will start receiving their BTC. This distribution raises a significant concern: selling pressure.
With Bitcoin’s price having soared by 16,000% since the hack, many creditors will be eager to cash in their BTC for a profit. This sudden influx of selling could cause a notable dip in Bitcoin prices.

There’s been a sharp decline in BTC inflows to exchanges, indicating that fewer Bitcoins are being moved to exchanges for selling, which could be a bullish sign.
The SMA line follows closely below the actual miner reserve data, indicating that while there have been ups and downs, the general movement has been relatively stable or slightly increasing.
This means that miners have maintained or slightly increased their holdings on average, indicating a possible bullish sentiment among miners.

Technical indicators show stability and bearishness
Bitcoin’s CMF value is positive (0.15), indicating that the buying pressure is exceeding the selling pressure over the given period.
This suggests that there is an accumulation happening, potentially indicating that investors are preparing or are optimistic about Bitcoin’s near-term price stability or growth despite potential sell-offs.

Interestingly, the overall trend in the OBV Oscillator is slightly downward towards the end of the chart. This hints at a possible increase in selling pressure or less buying momentum compared to previous sessions.
The Accumulation/Distribution Line is trending upward, indicating that Bitcoin is being accumulated, which generally suggests bullish sentiment among traders.
The rise in this line, particularly in the context of positive CMF values, reinforces the idea that despite the overarching concerns, there might be a strong undercurrent of buying interest.
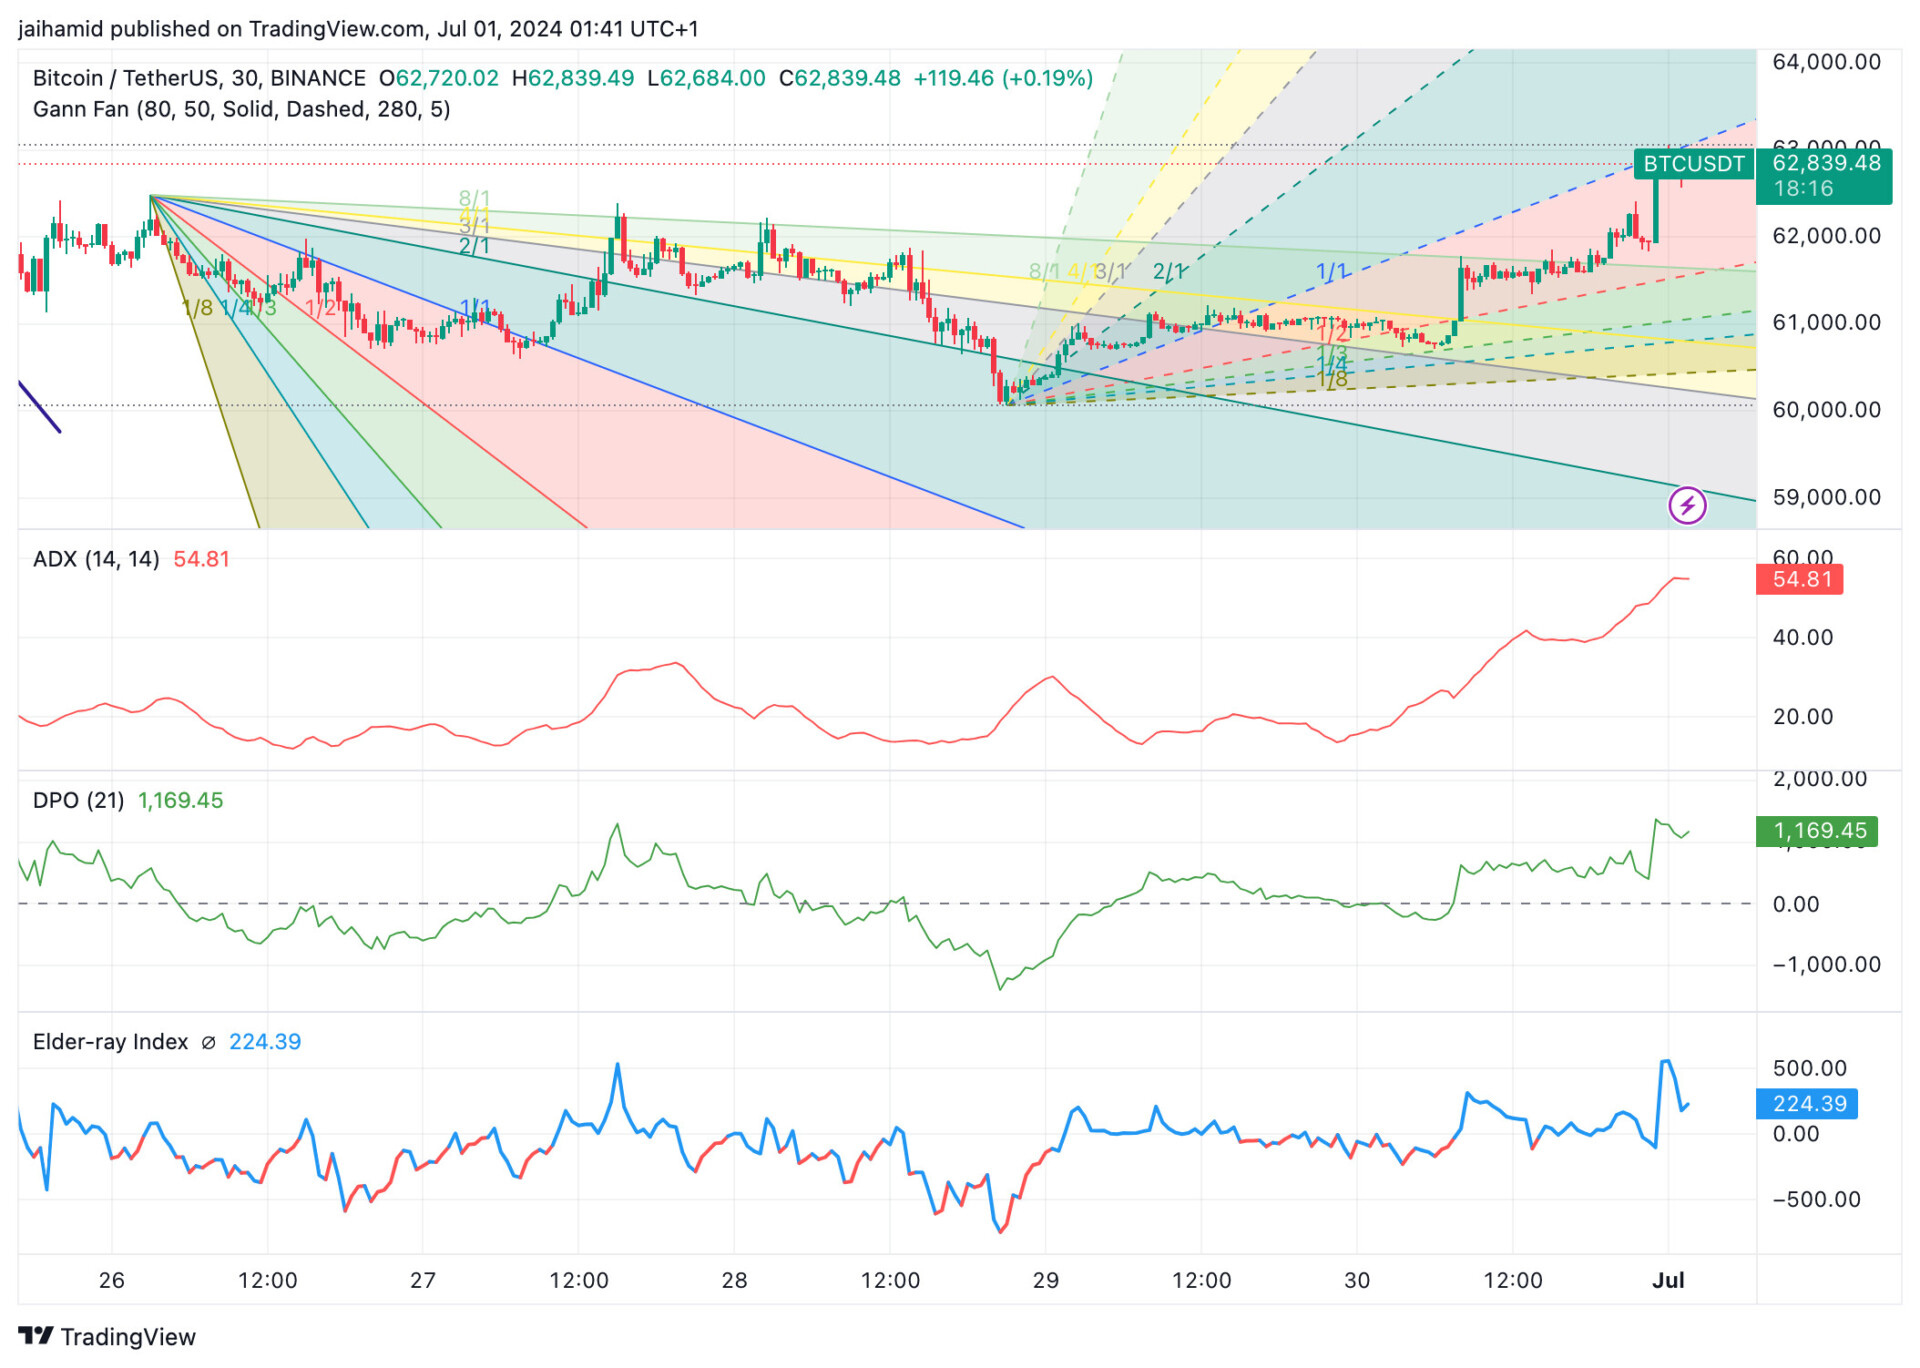
Meanwhile, the Gann lines intersect and overlap with the price action of Bitcoin, suggesting various potential points of support and resistance. The price is currently testing an upward angle, which may act as resistance.

Successfully breaking above this line could signal a stronger bullish trend, whereas failure to break could lead to consolidation or a bearish reversal.
The ADX here is well above 50, indicating a very strong market trend. The red line’s high level suggests that the current trend, whether bullish or bearish, has strong momentum.
This could be important if the market becomes volatile due to external factors like the Mt. Gox repayments.
The Elder-Ray Index in this chart shows the bull power (green line) and bear power (blue line) fluctuating, with recent readings showing increased bearish pressure (blue line dips).
The DPO shows a wavy pattern around the zero line but remains predominantly above it, indicating short-term price cycles are higher than their centered averages.
This could imply short-term bullish momentum, but traders will watch for any movement below zero as a potential warning sign of reversal.
Reporting and analysis by Jai Hamid


